
 01estate overview
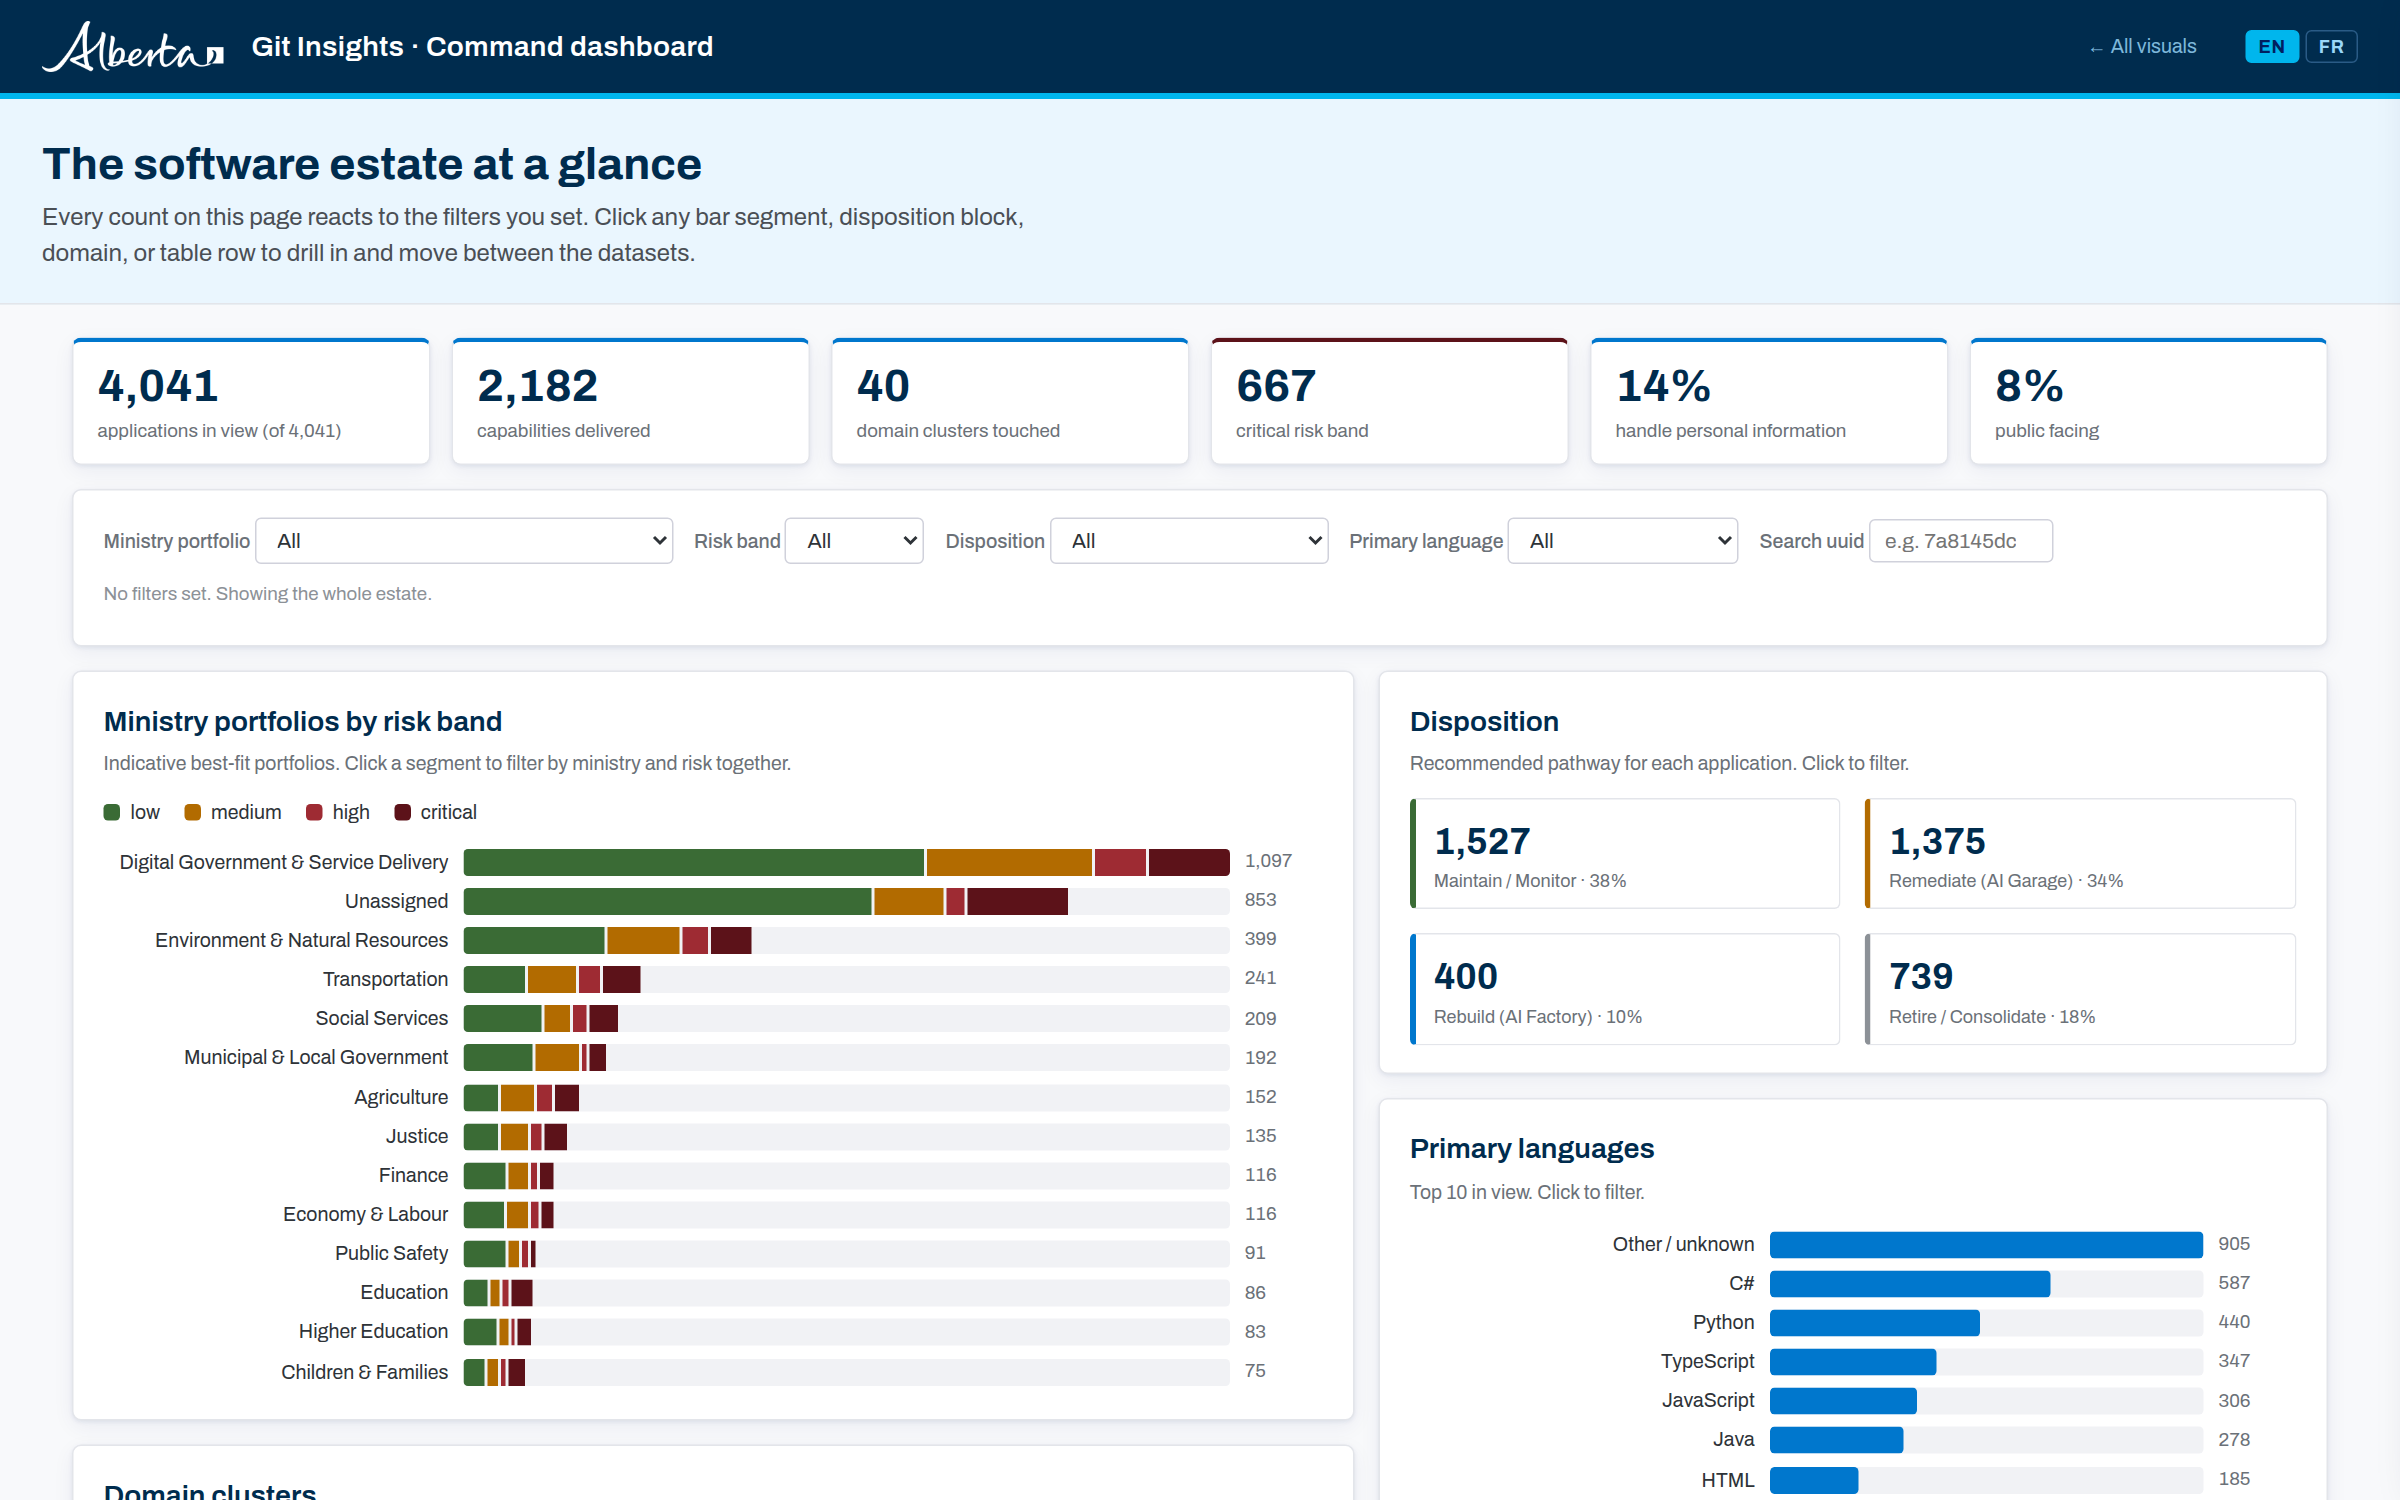
Command dashboard
Cross-filtered overview of the estate. Click segments to drill from ministries into domains, capabilities, and single application records.
 02capability map
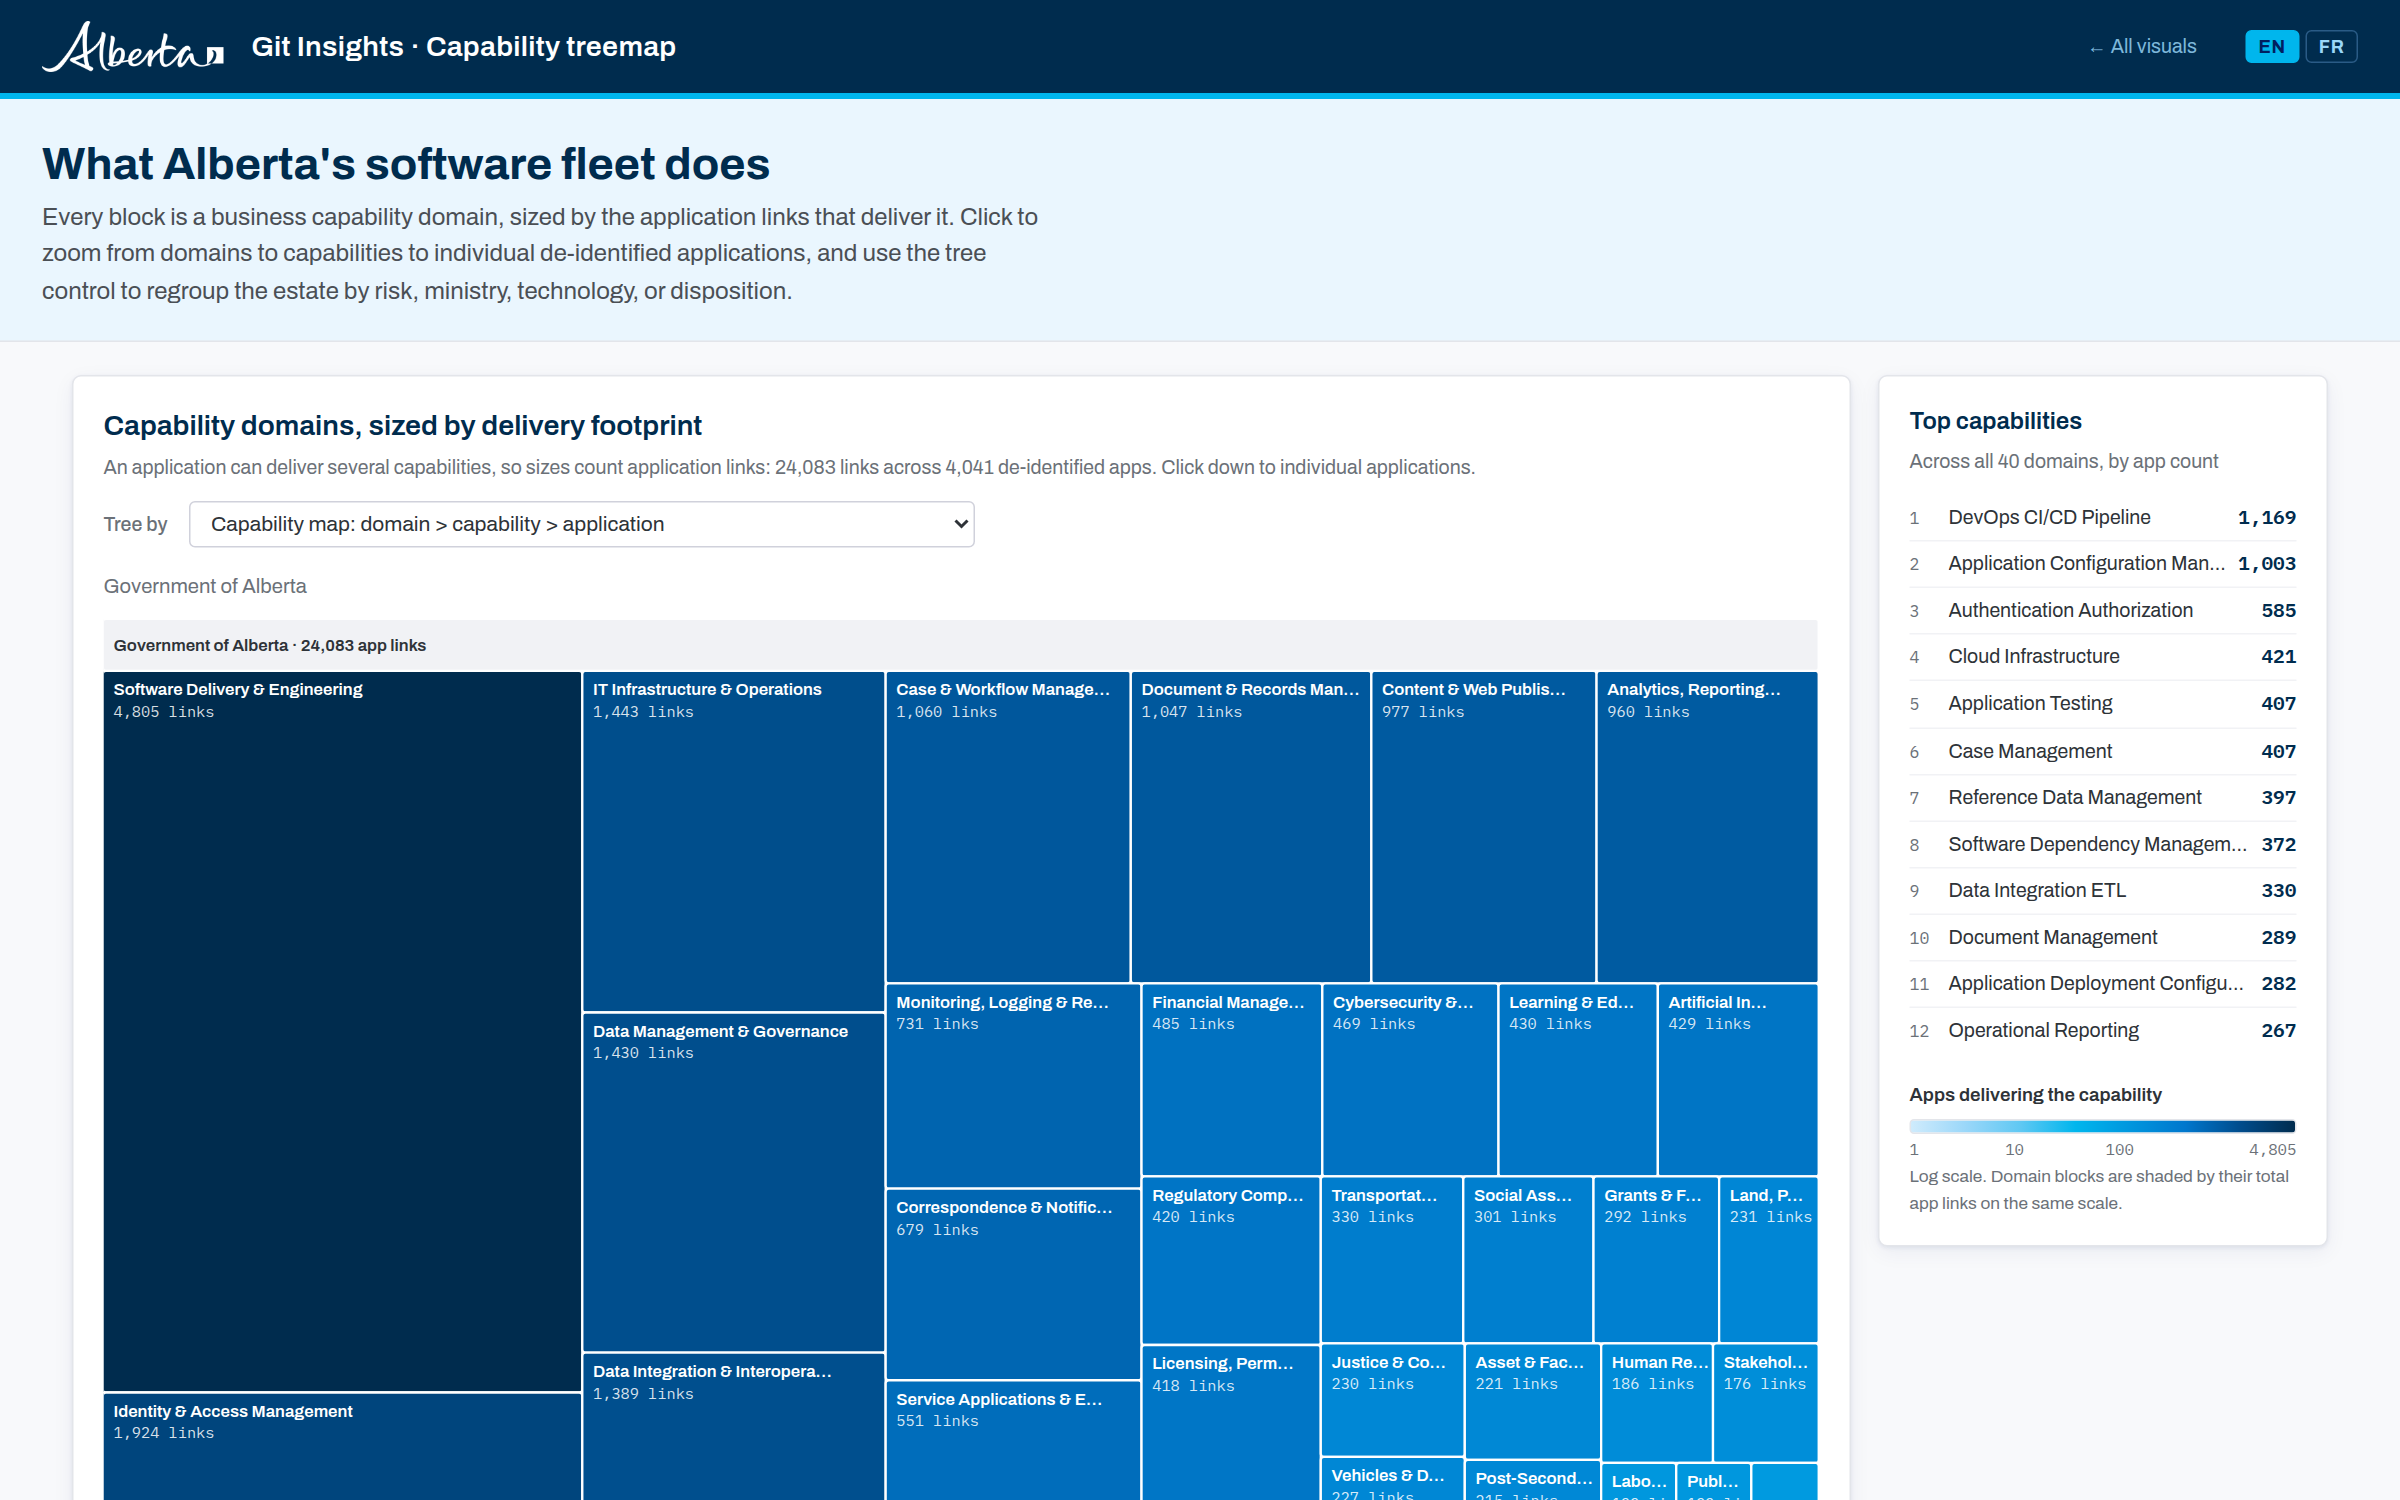
Zoomable capability treemap
All 40 domain clusters as nested tiles sized by delivering applications. Click to zoom into a domain and read its capabilities.
 03relationships
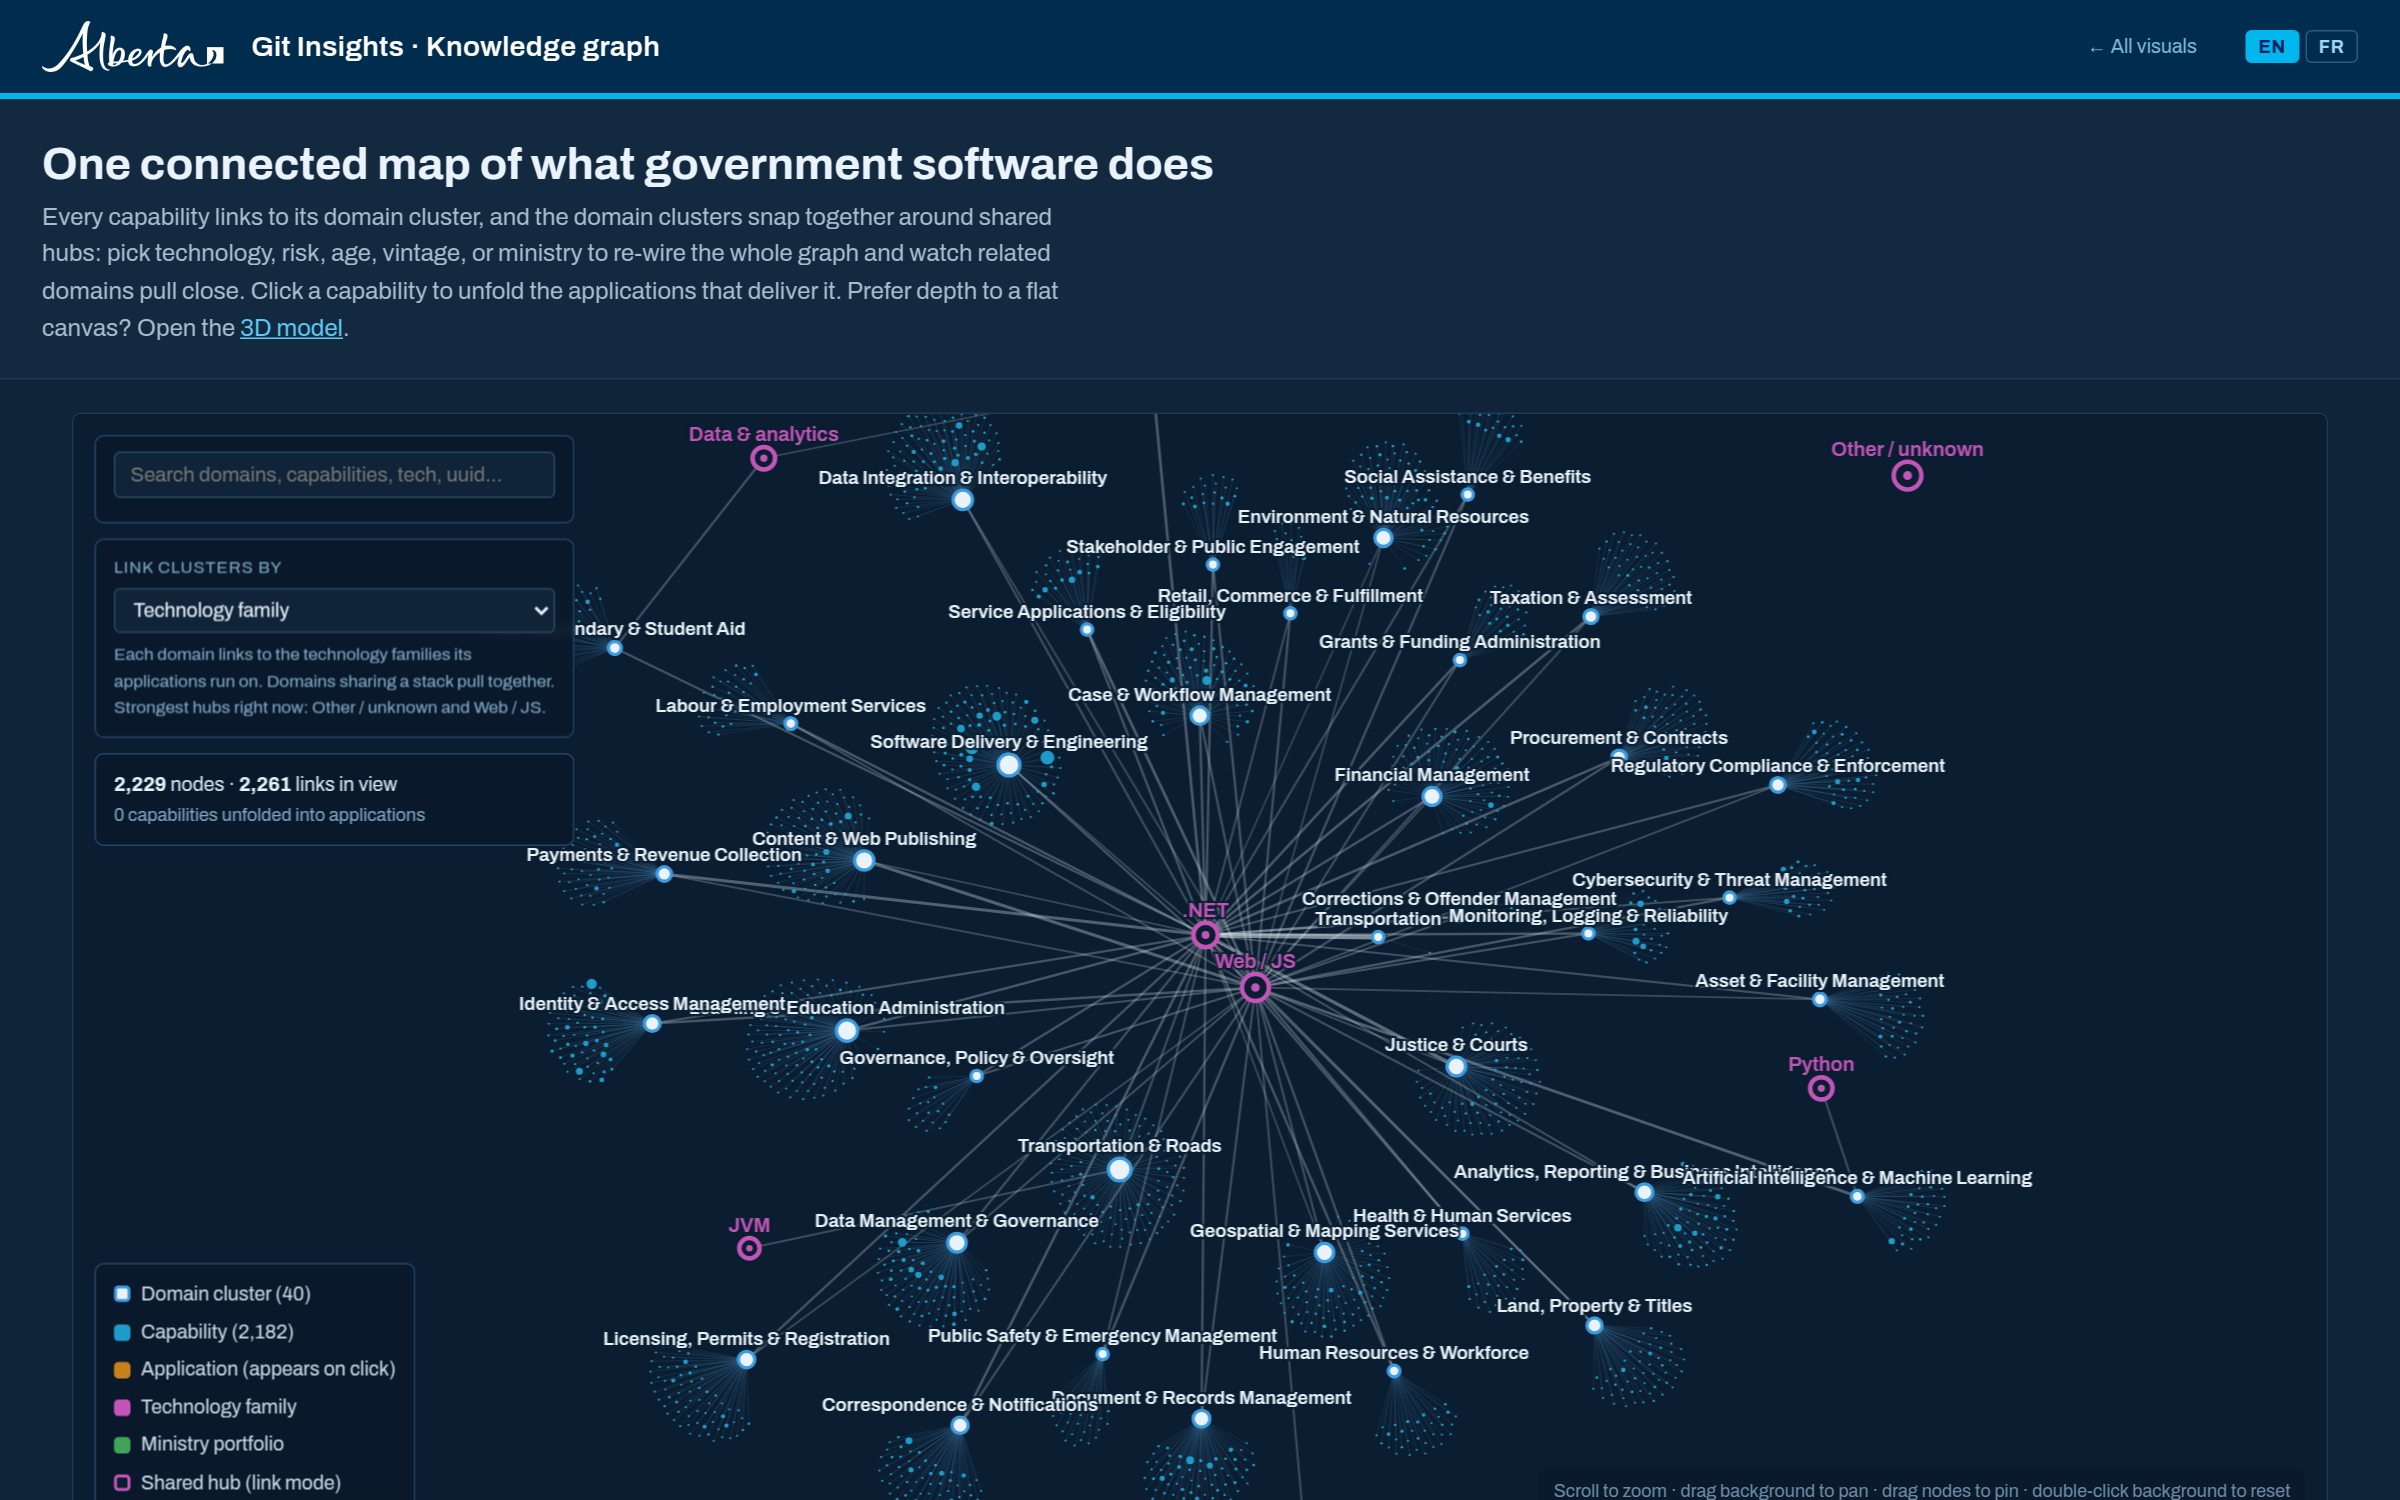
Knowledge graph
Domains, capabilities, applications, technology families, and ministries as one force-directed graph with typed, color-coded nodes.
 04risk by technology
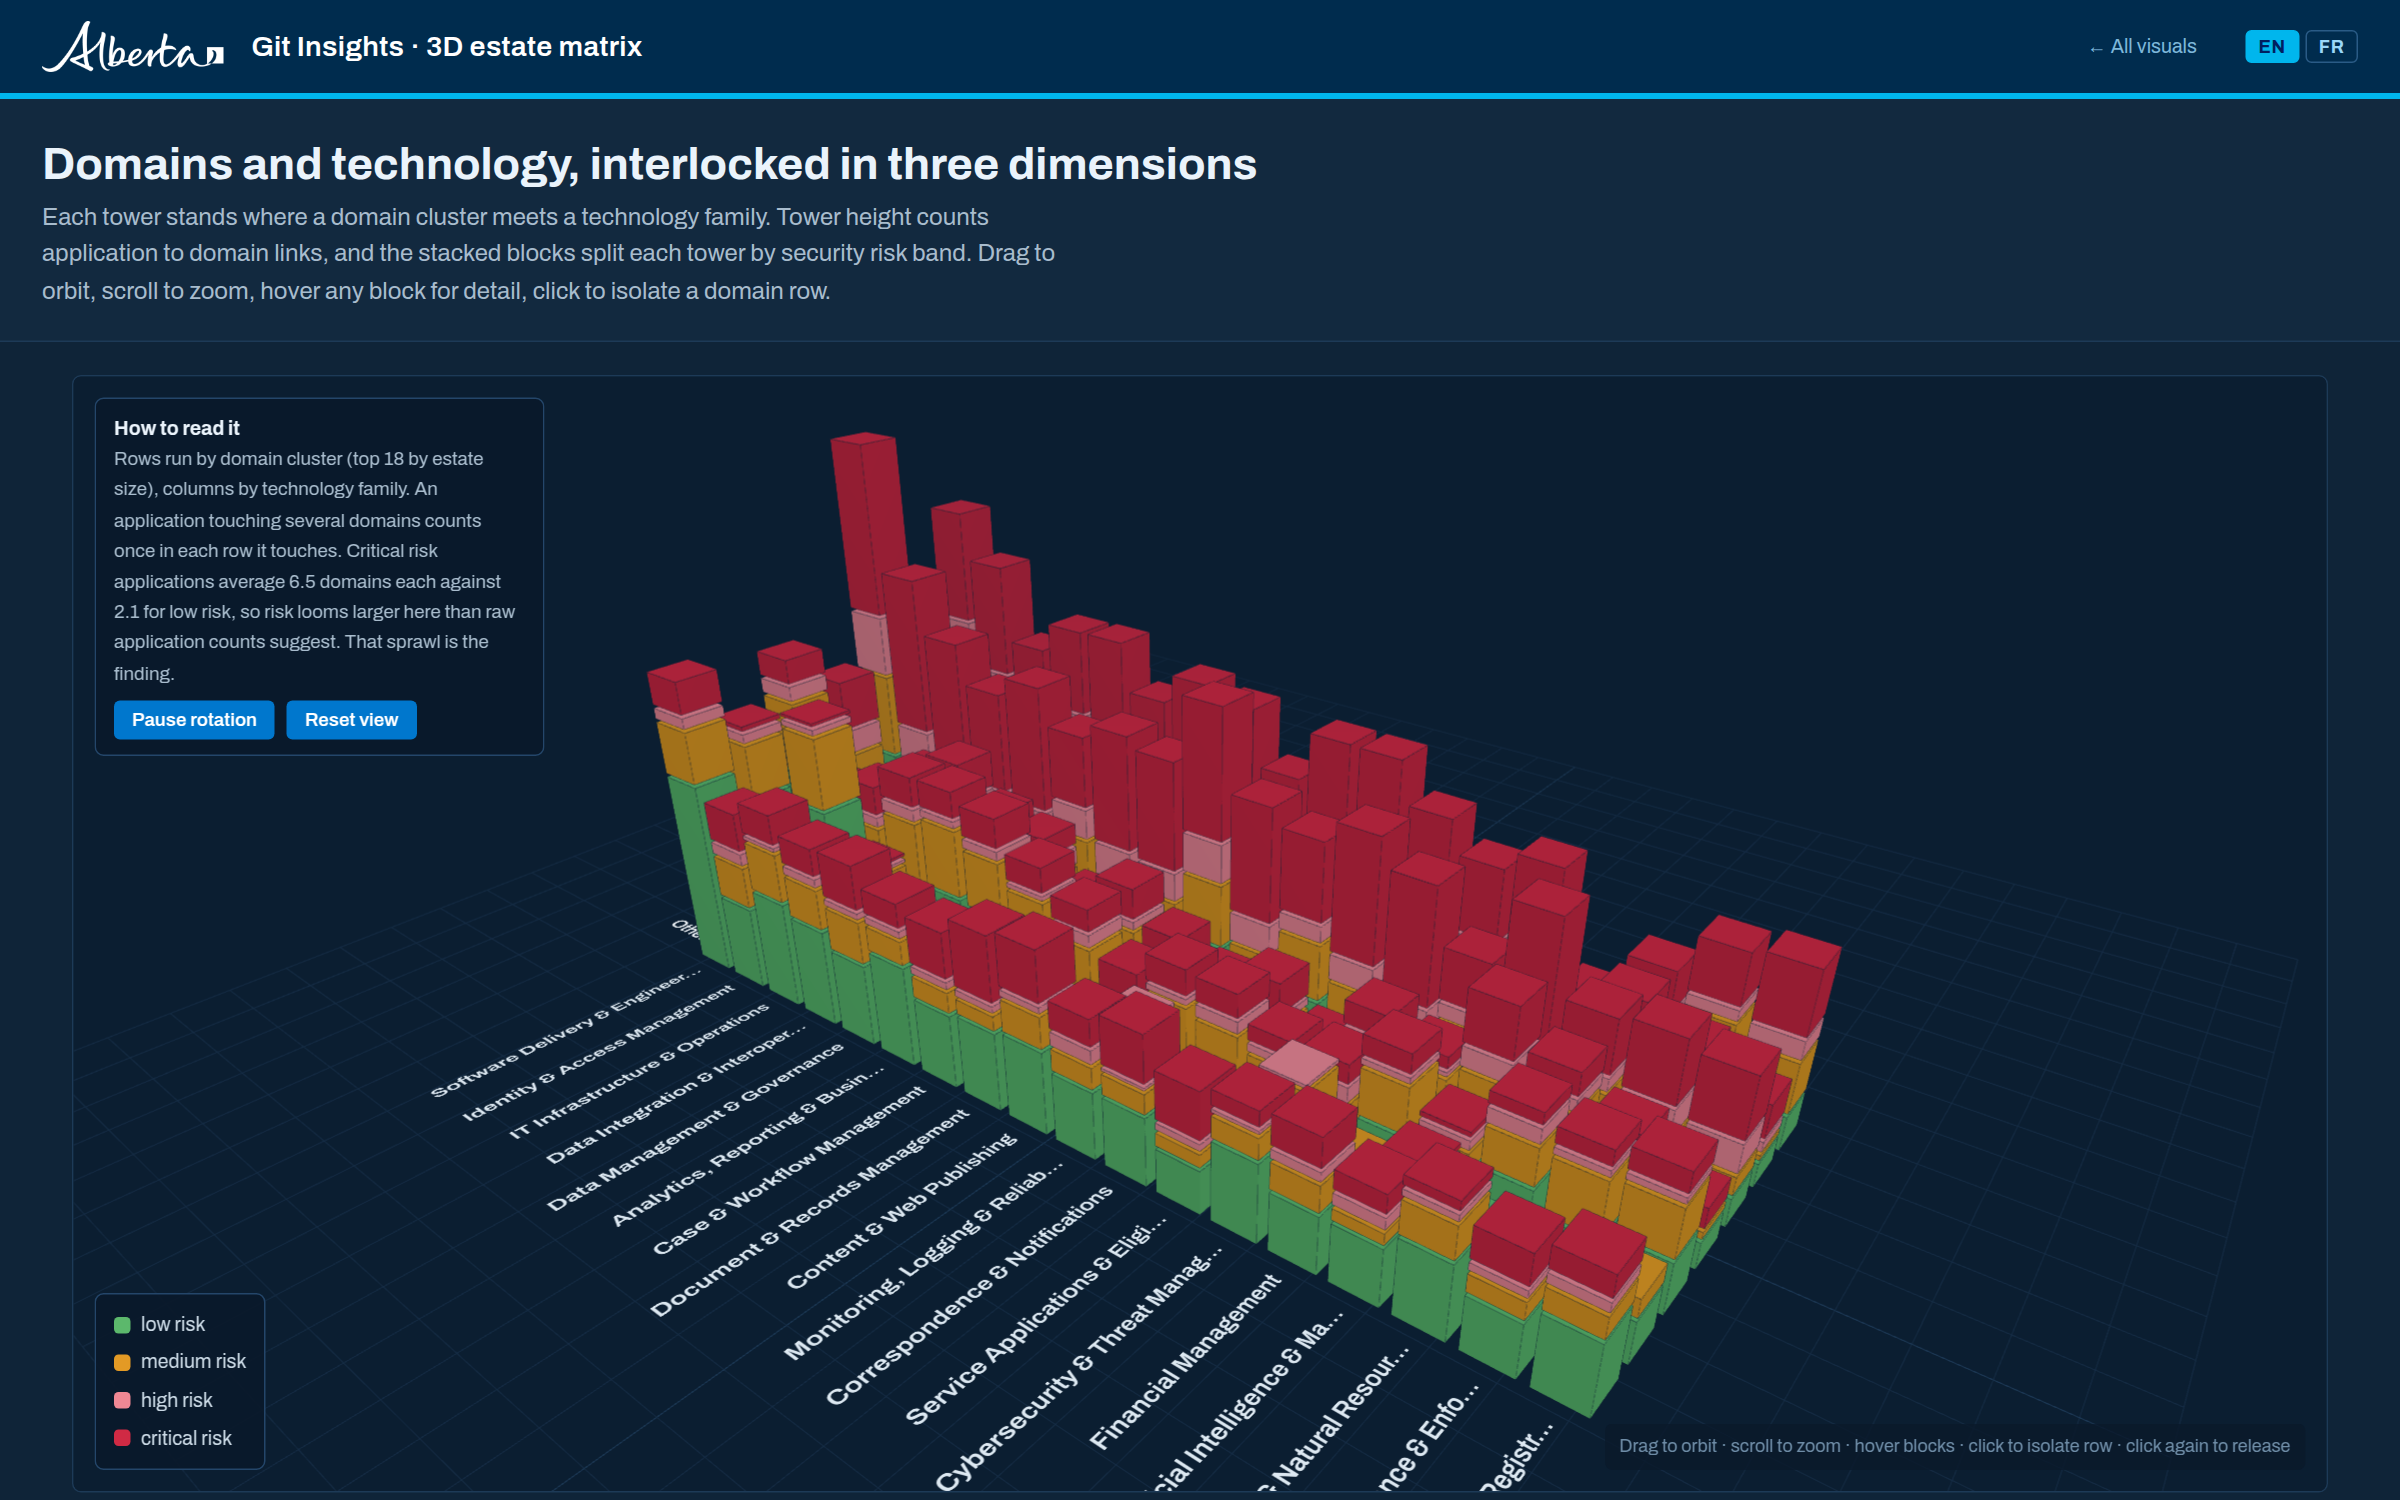
3D estate matrix
Domain rows meet technology columns in an orbiting block city. Tower height counts application links, block colors split each tower by risk band.
 05capability map
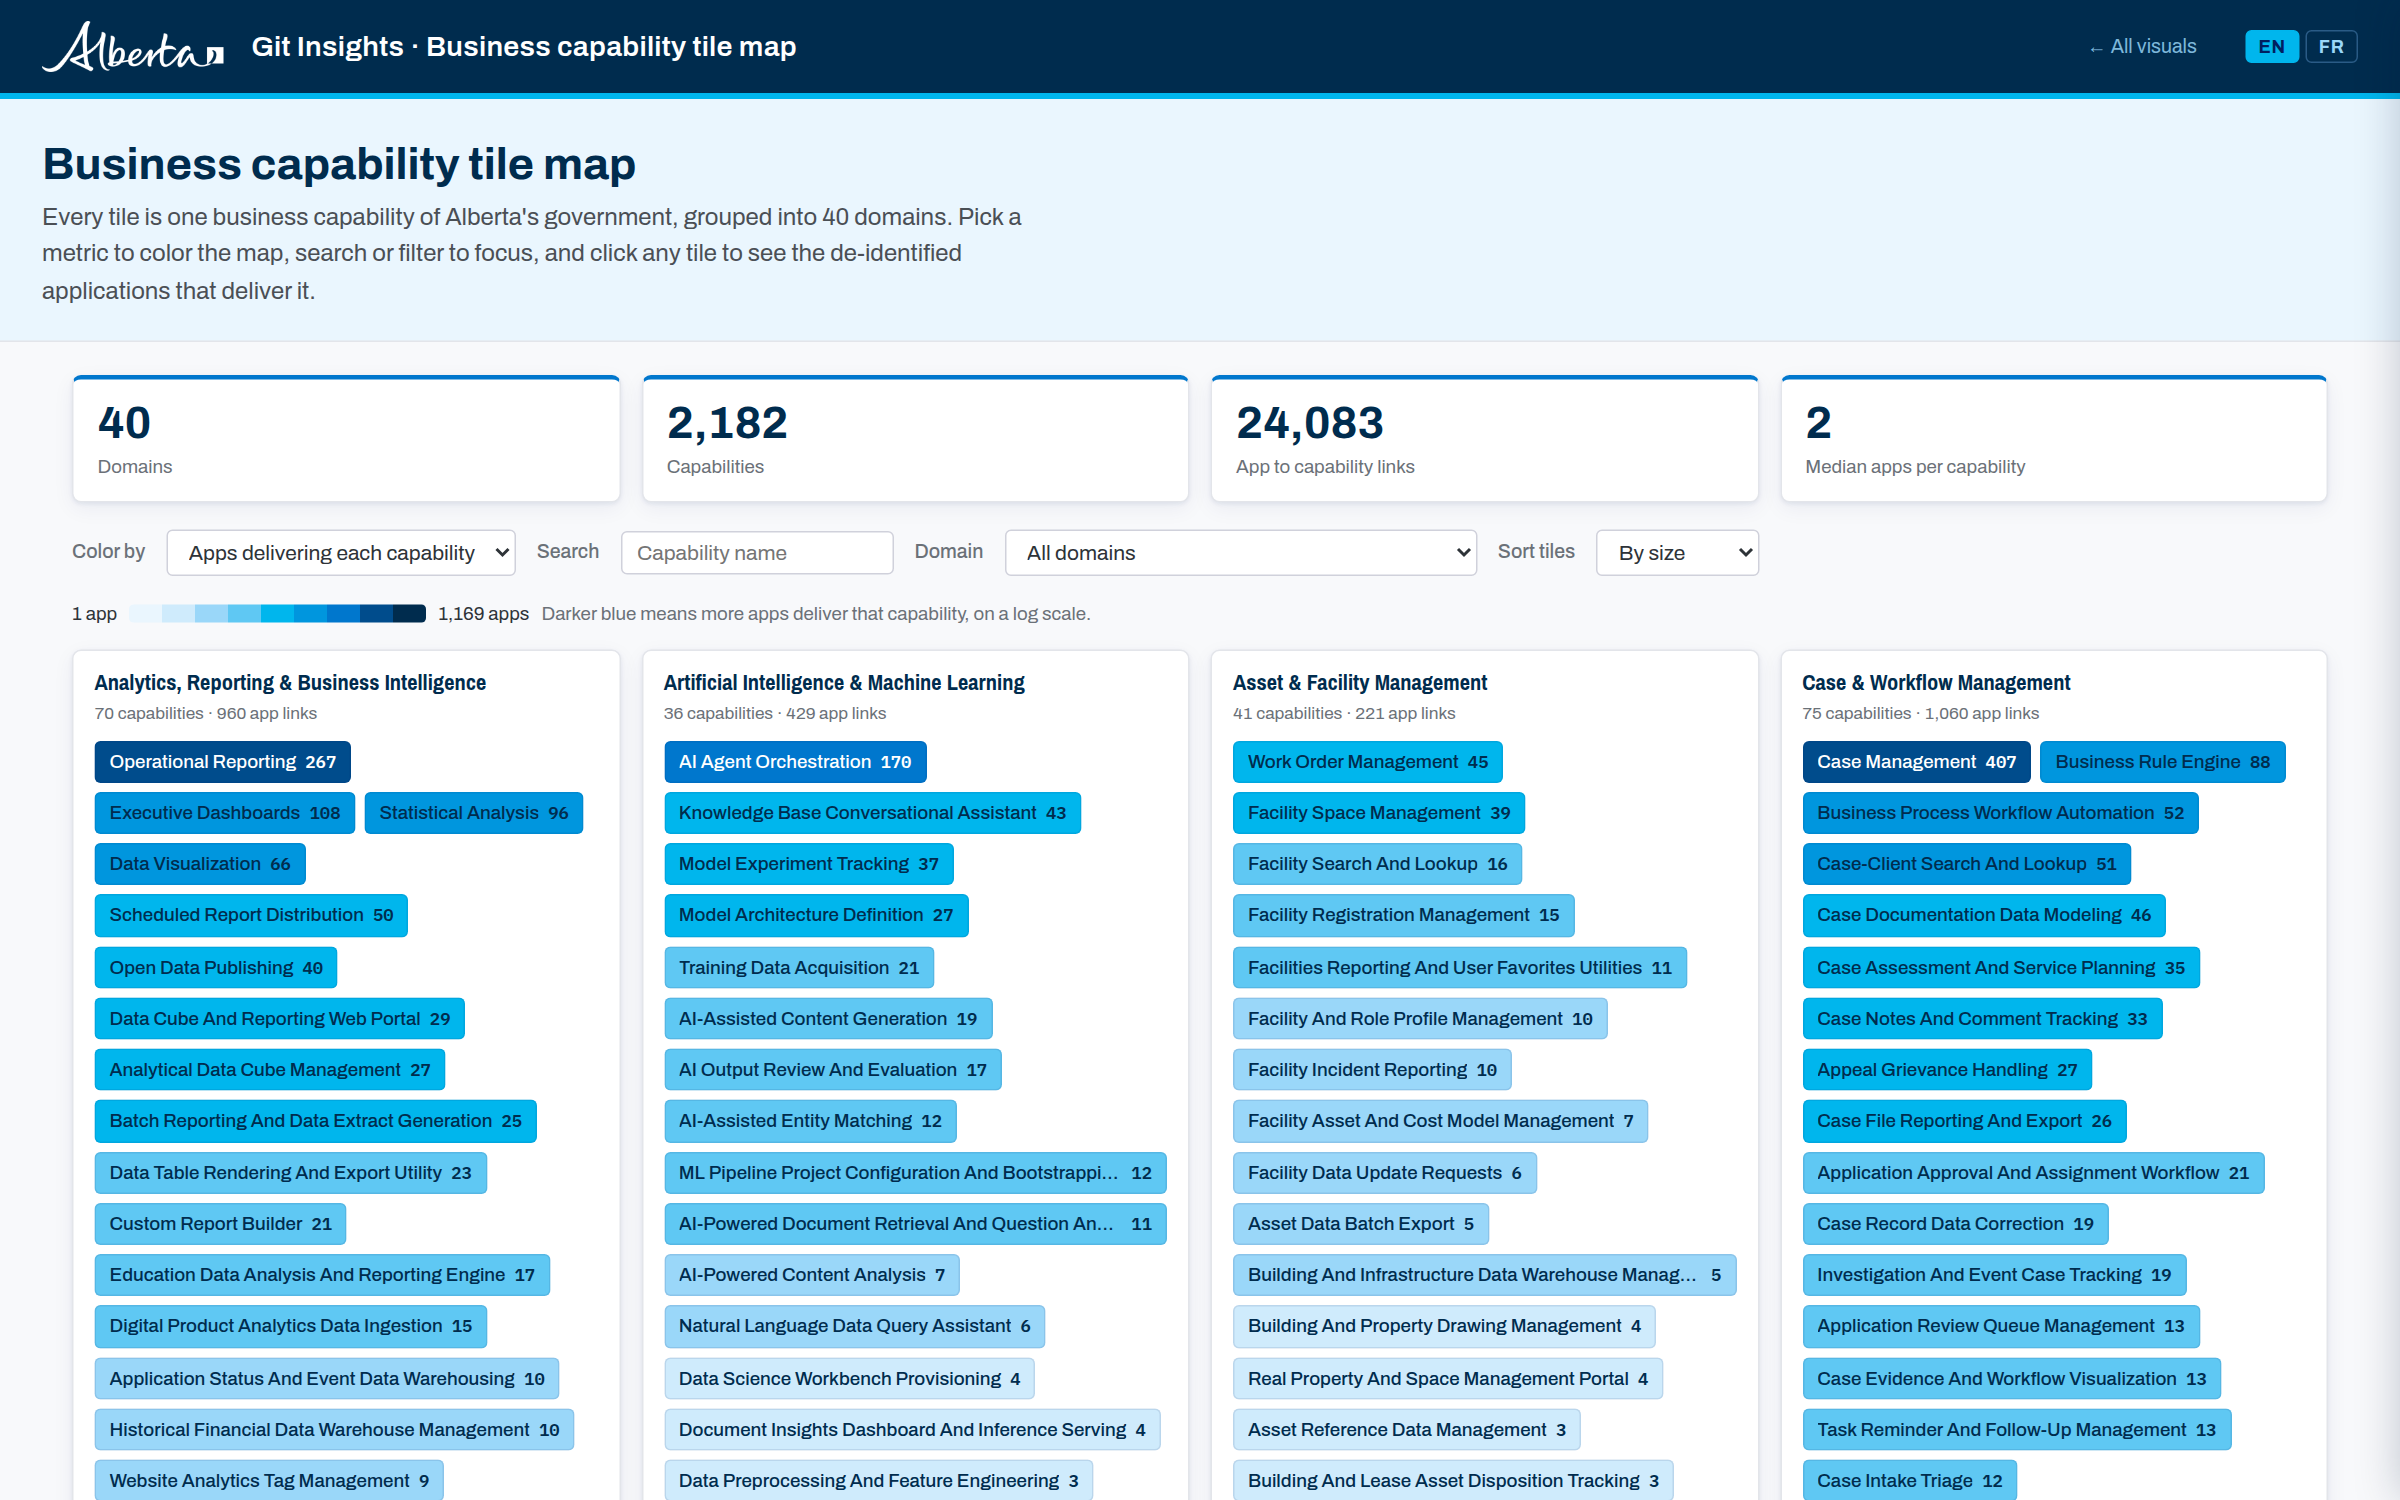
Business capability tiles
The full capability map as a wall of tiles, recolorable by apps delivering each capability, dominant risk, or consolidation candidates.
 06government function
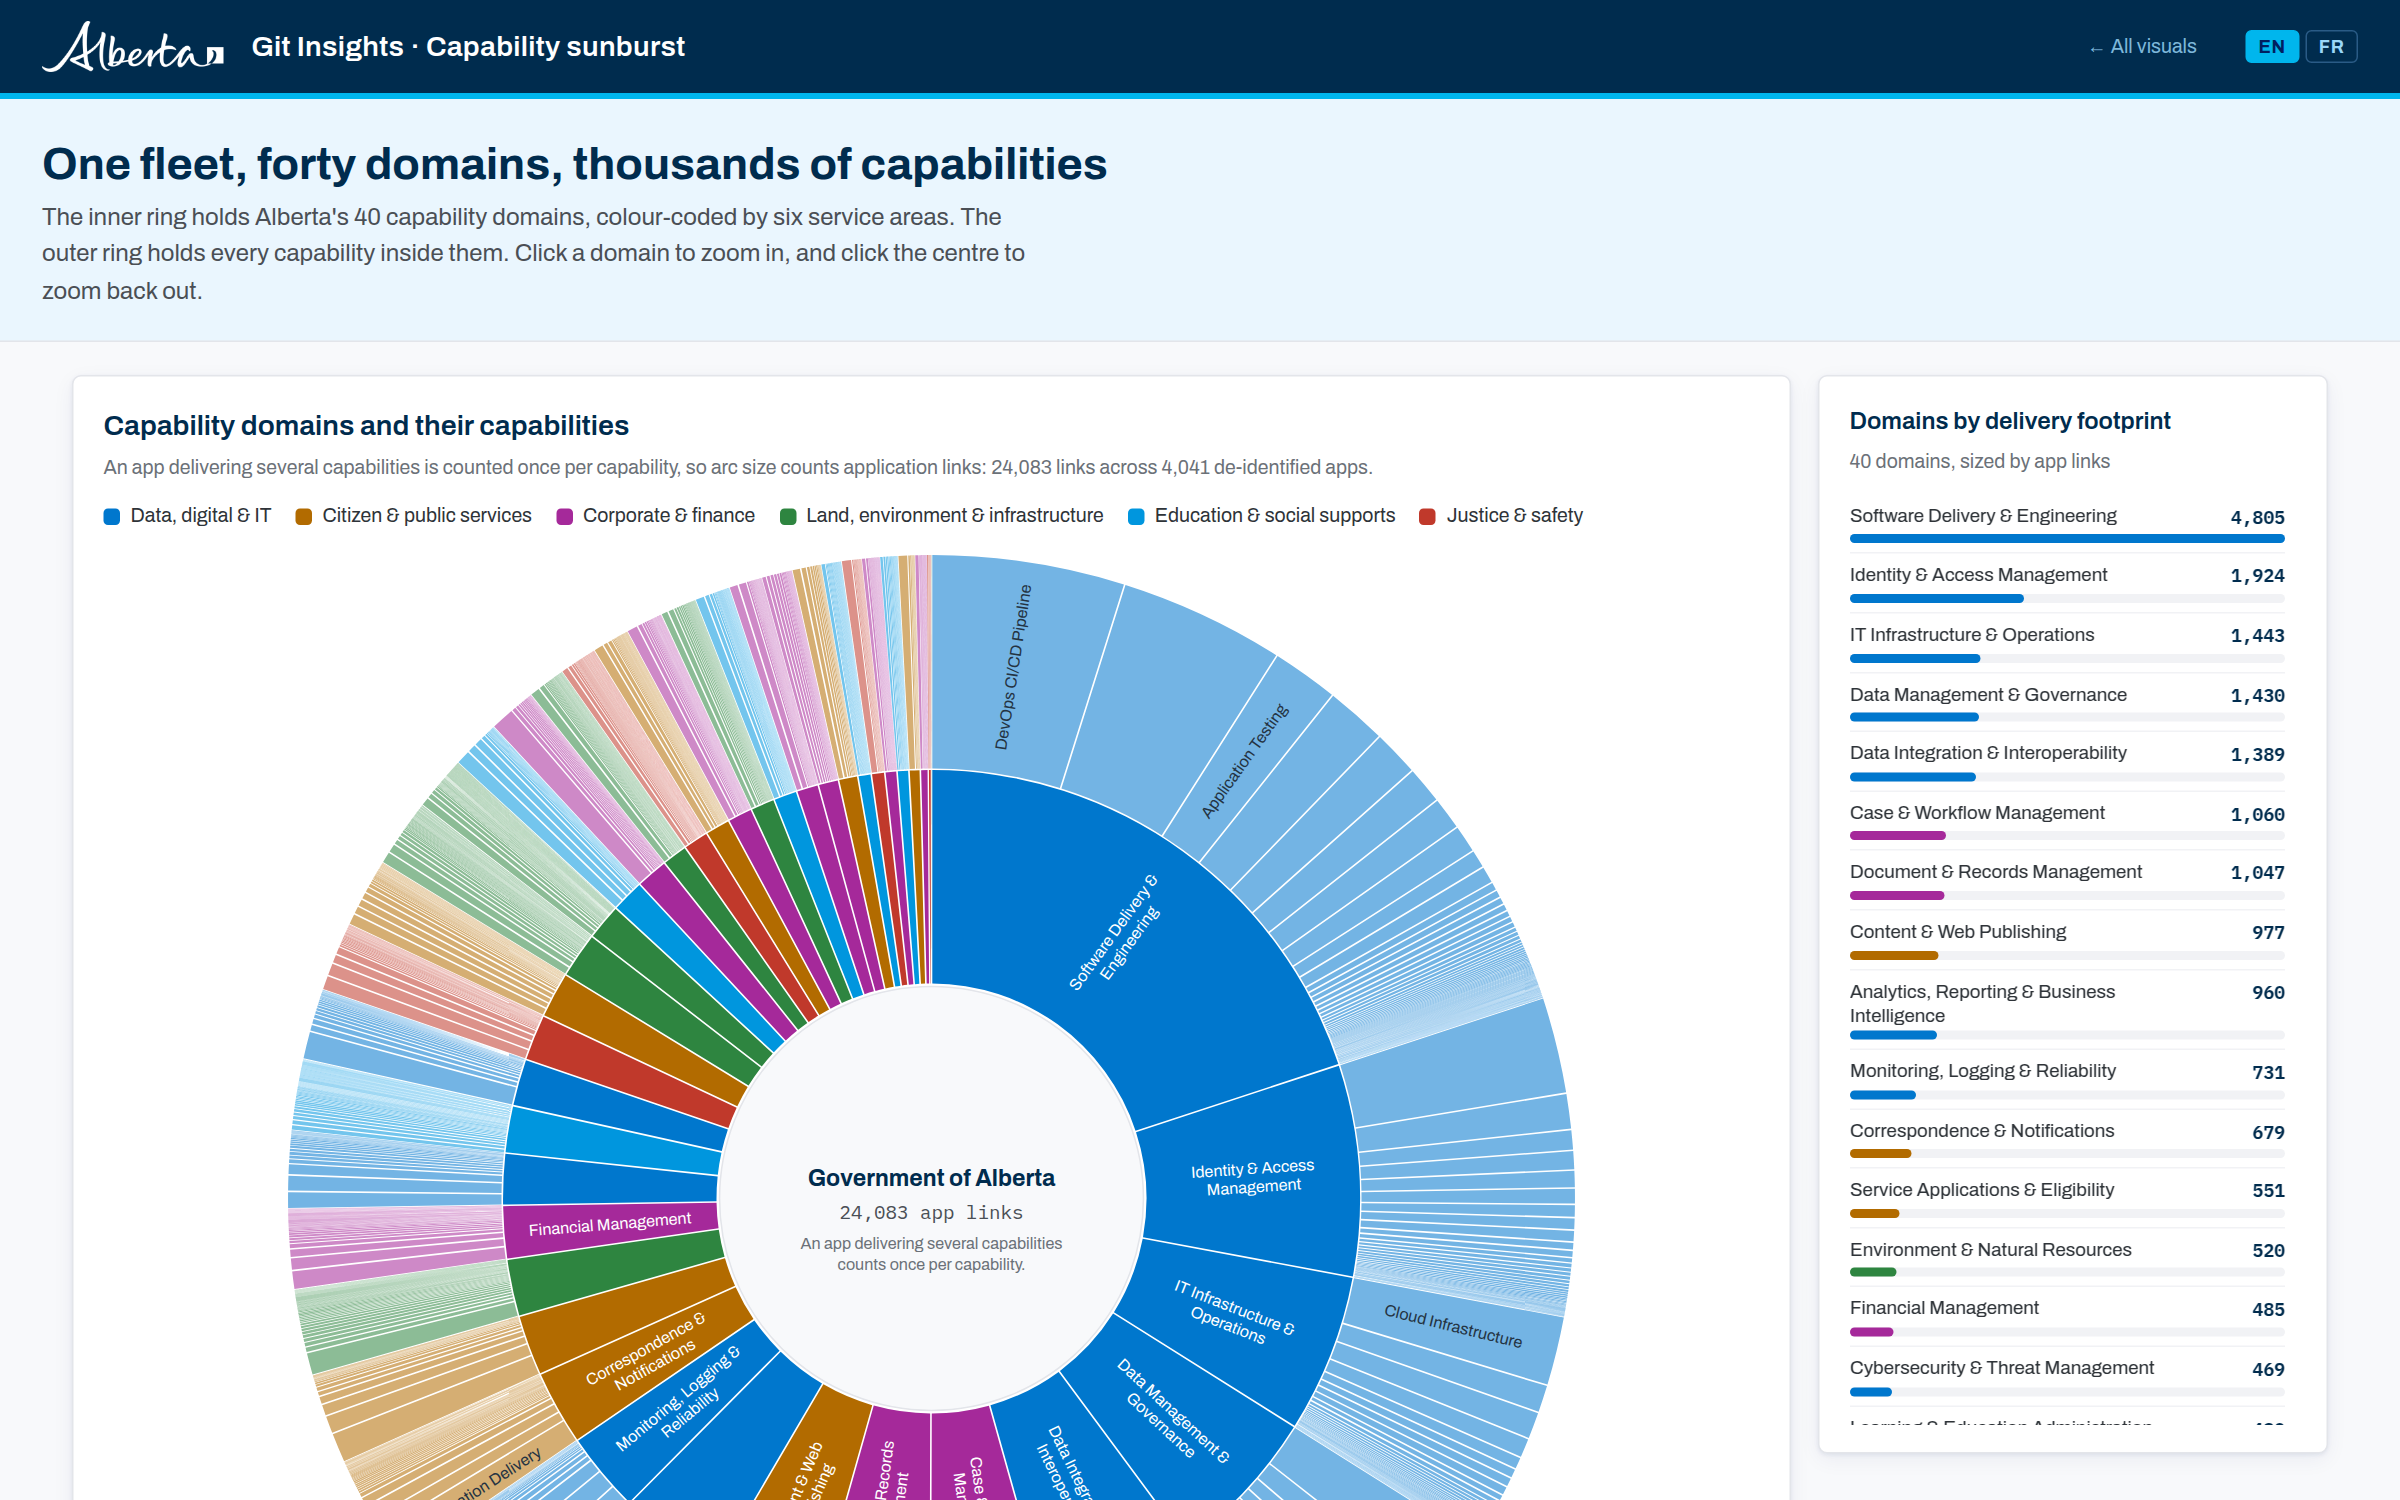
Capability sunburst
Government function as concentric rings. Click an arc to zoom into a domain and its capabilities, grouped into six service super-groups.
 07modernization flows
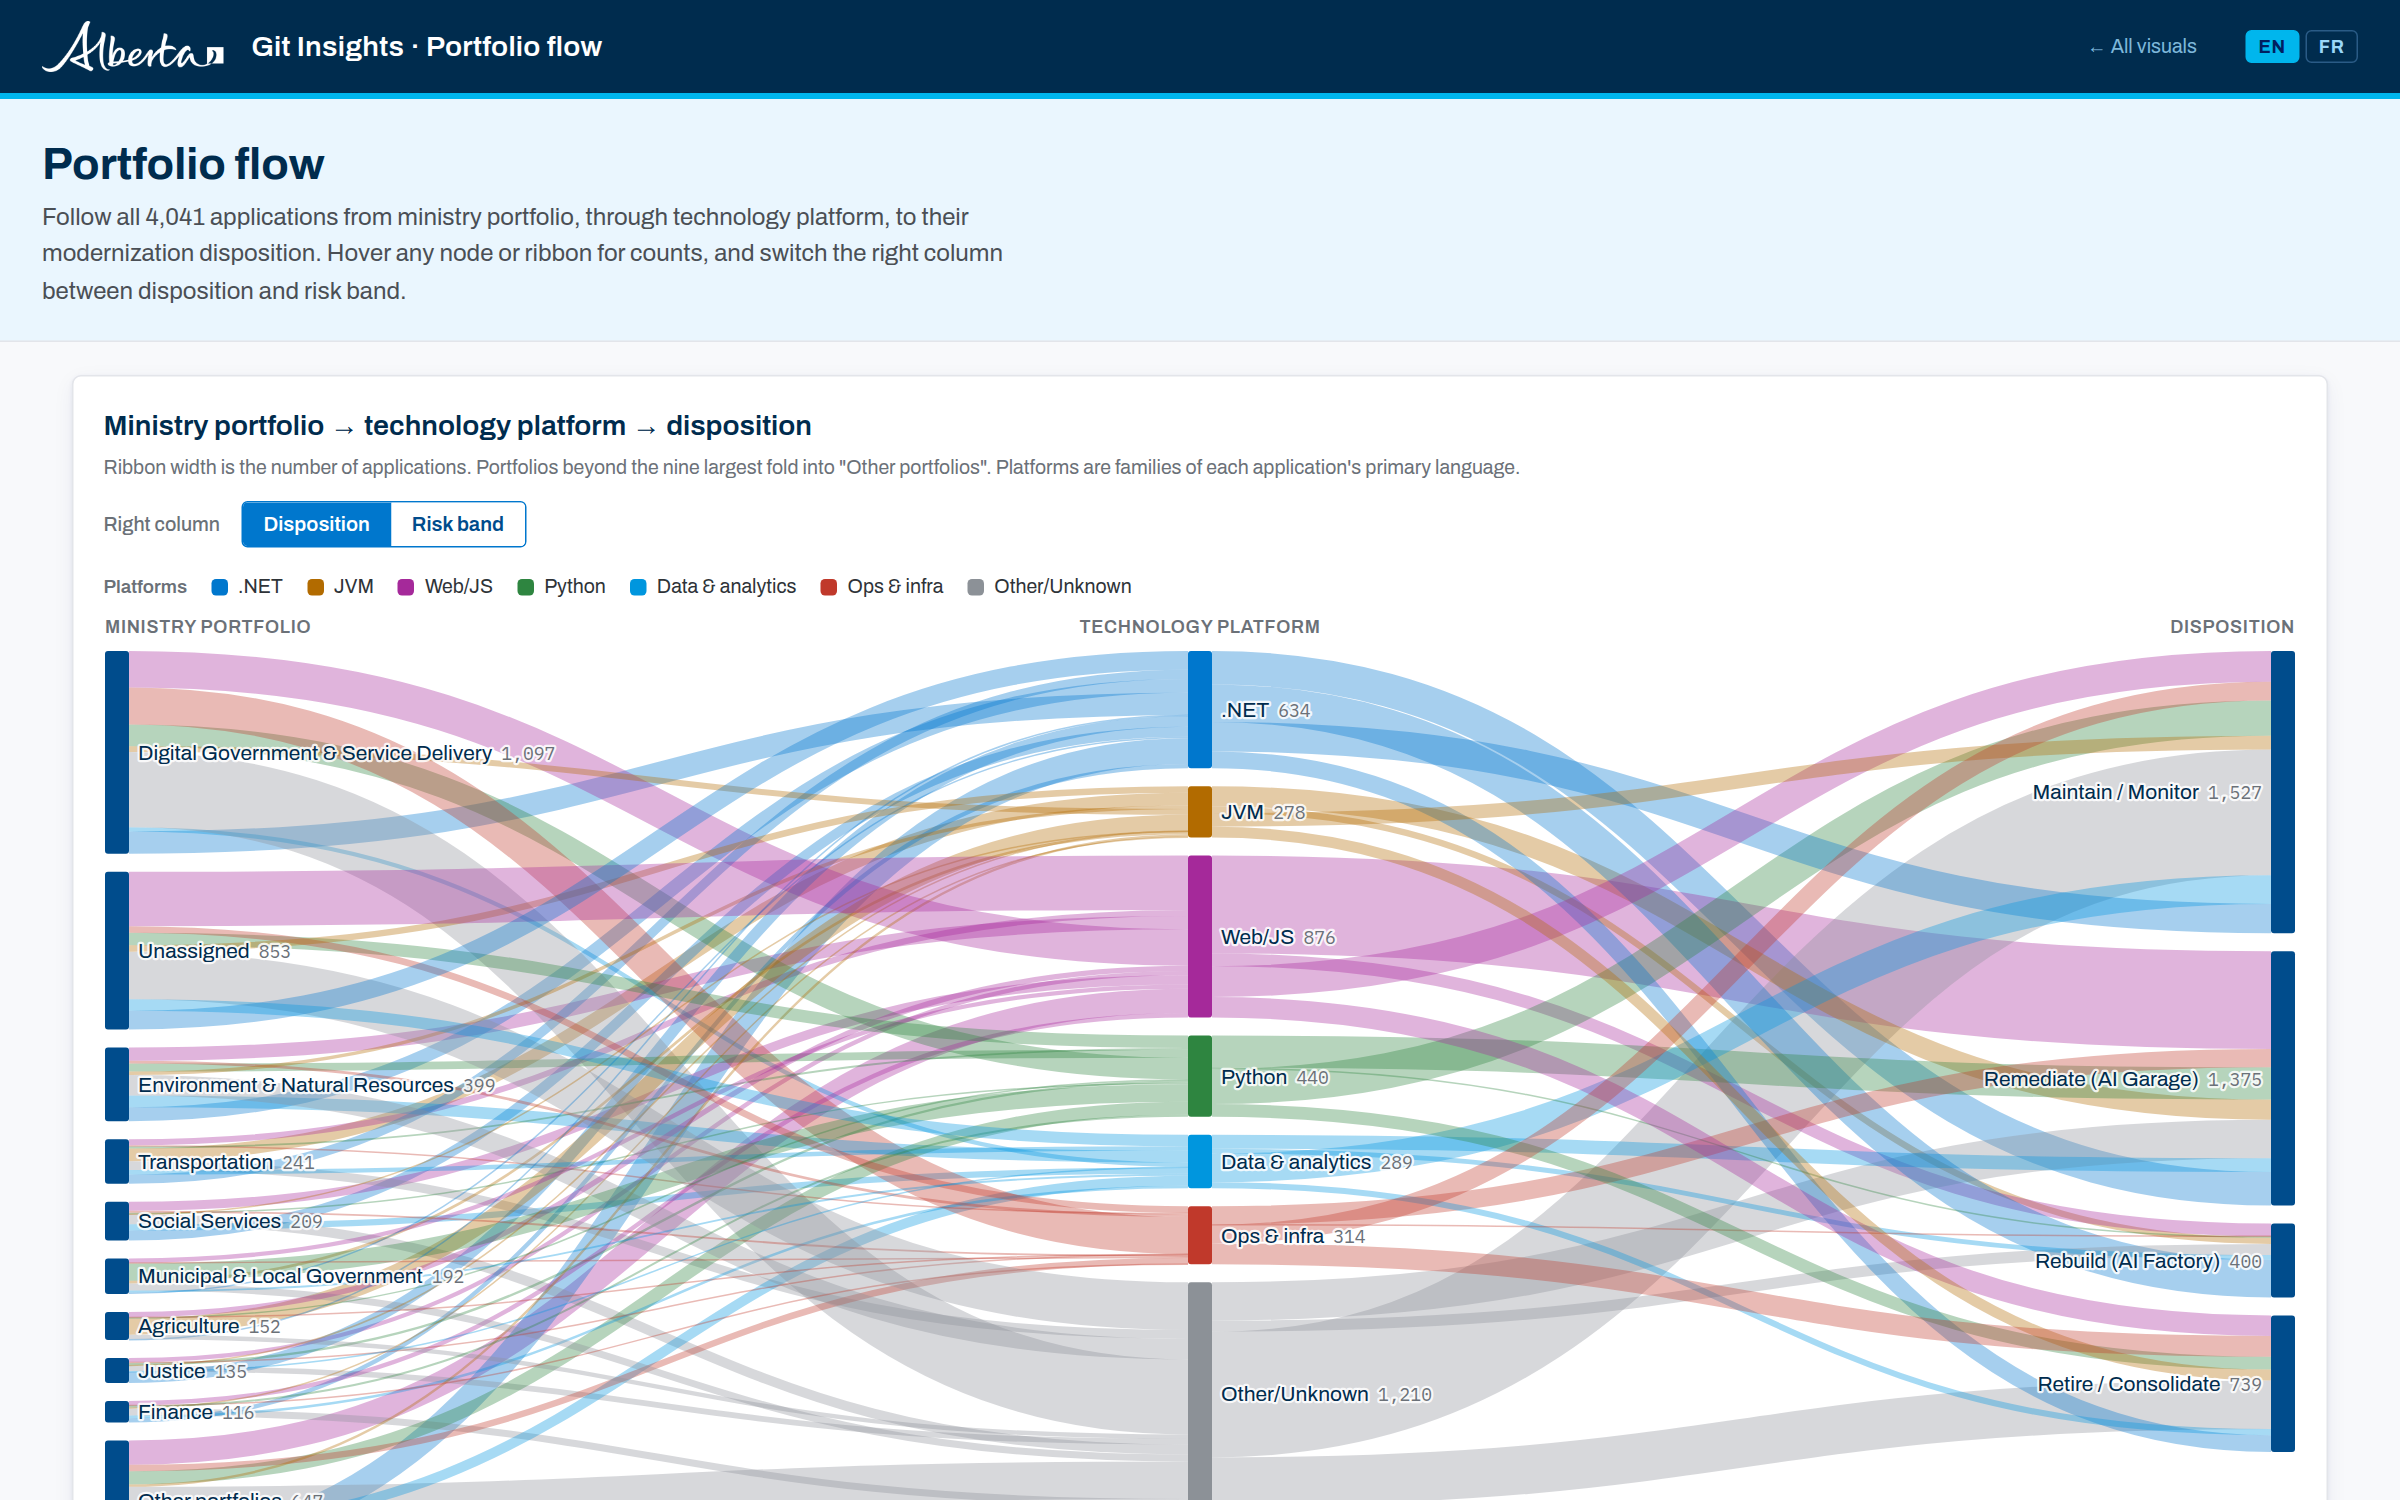
Portfolio flows
A sankey tracing all 4,041 applications from ministry portfolio through technology platform to modernization disposition or risk band.
 08risk and cost
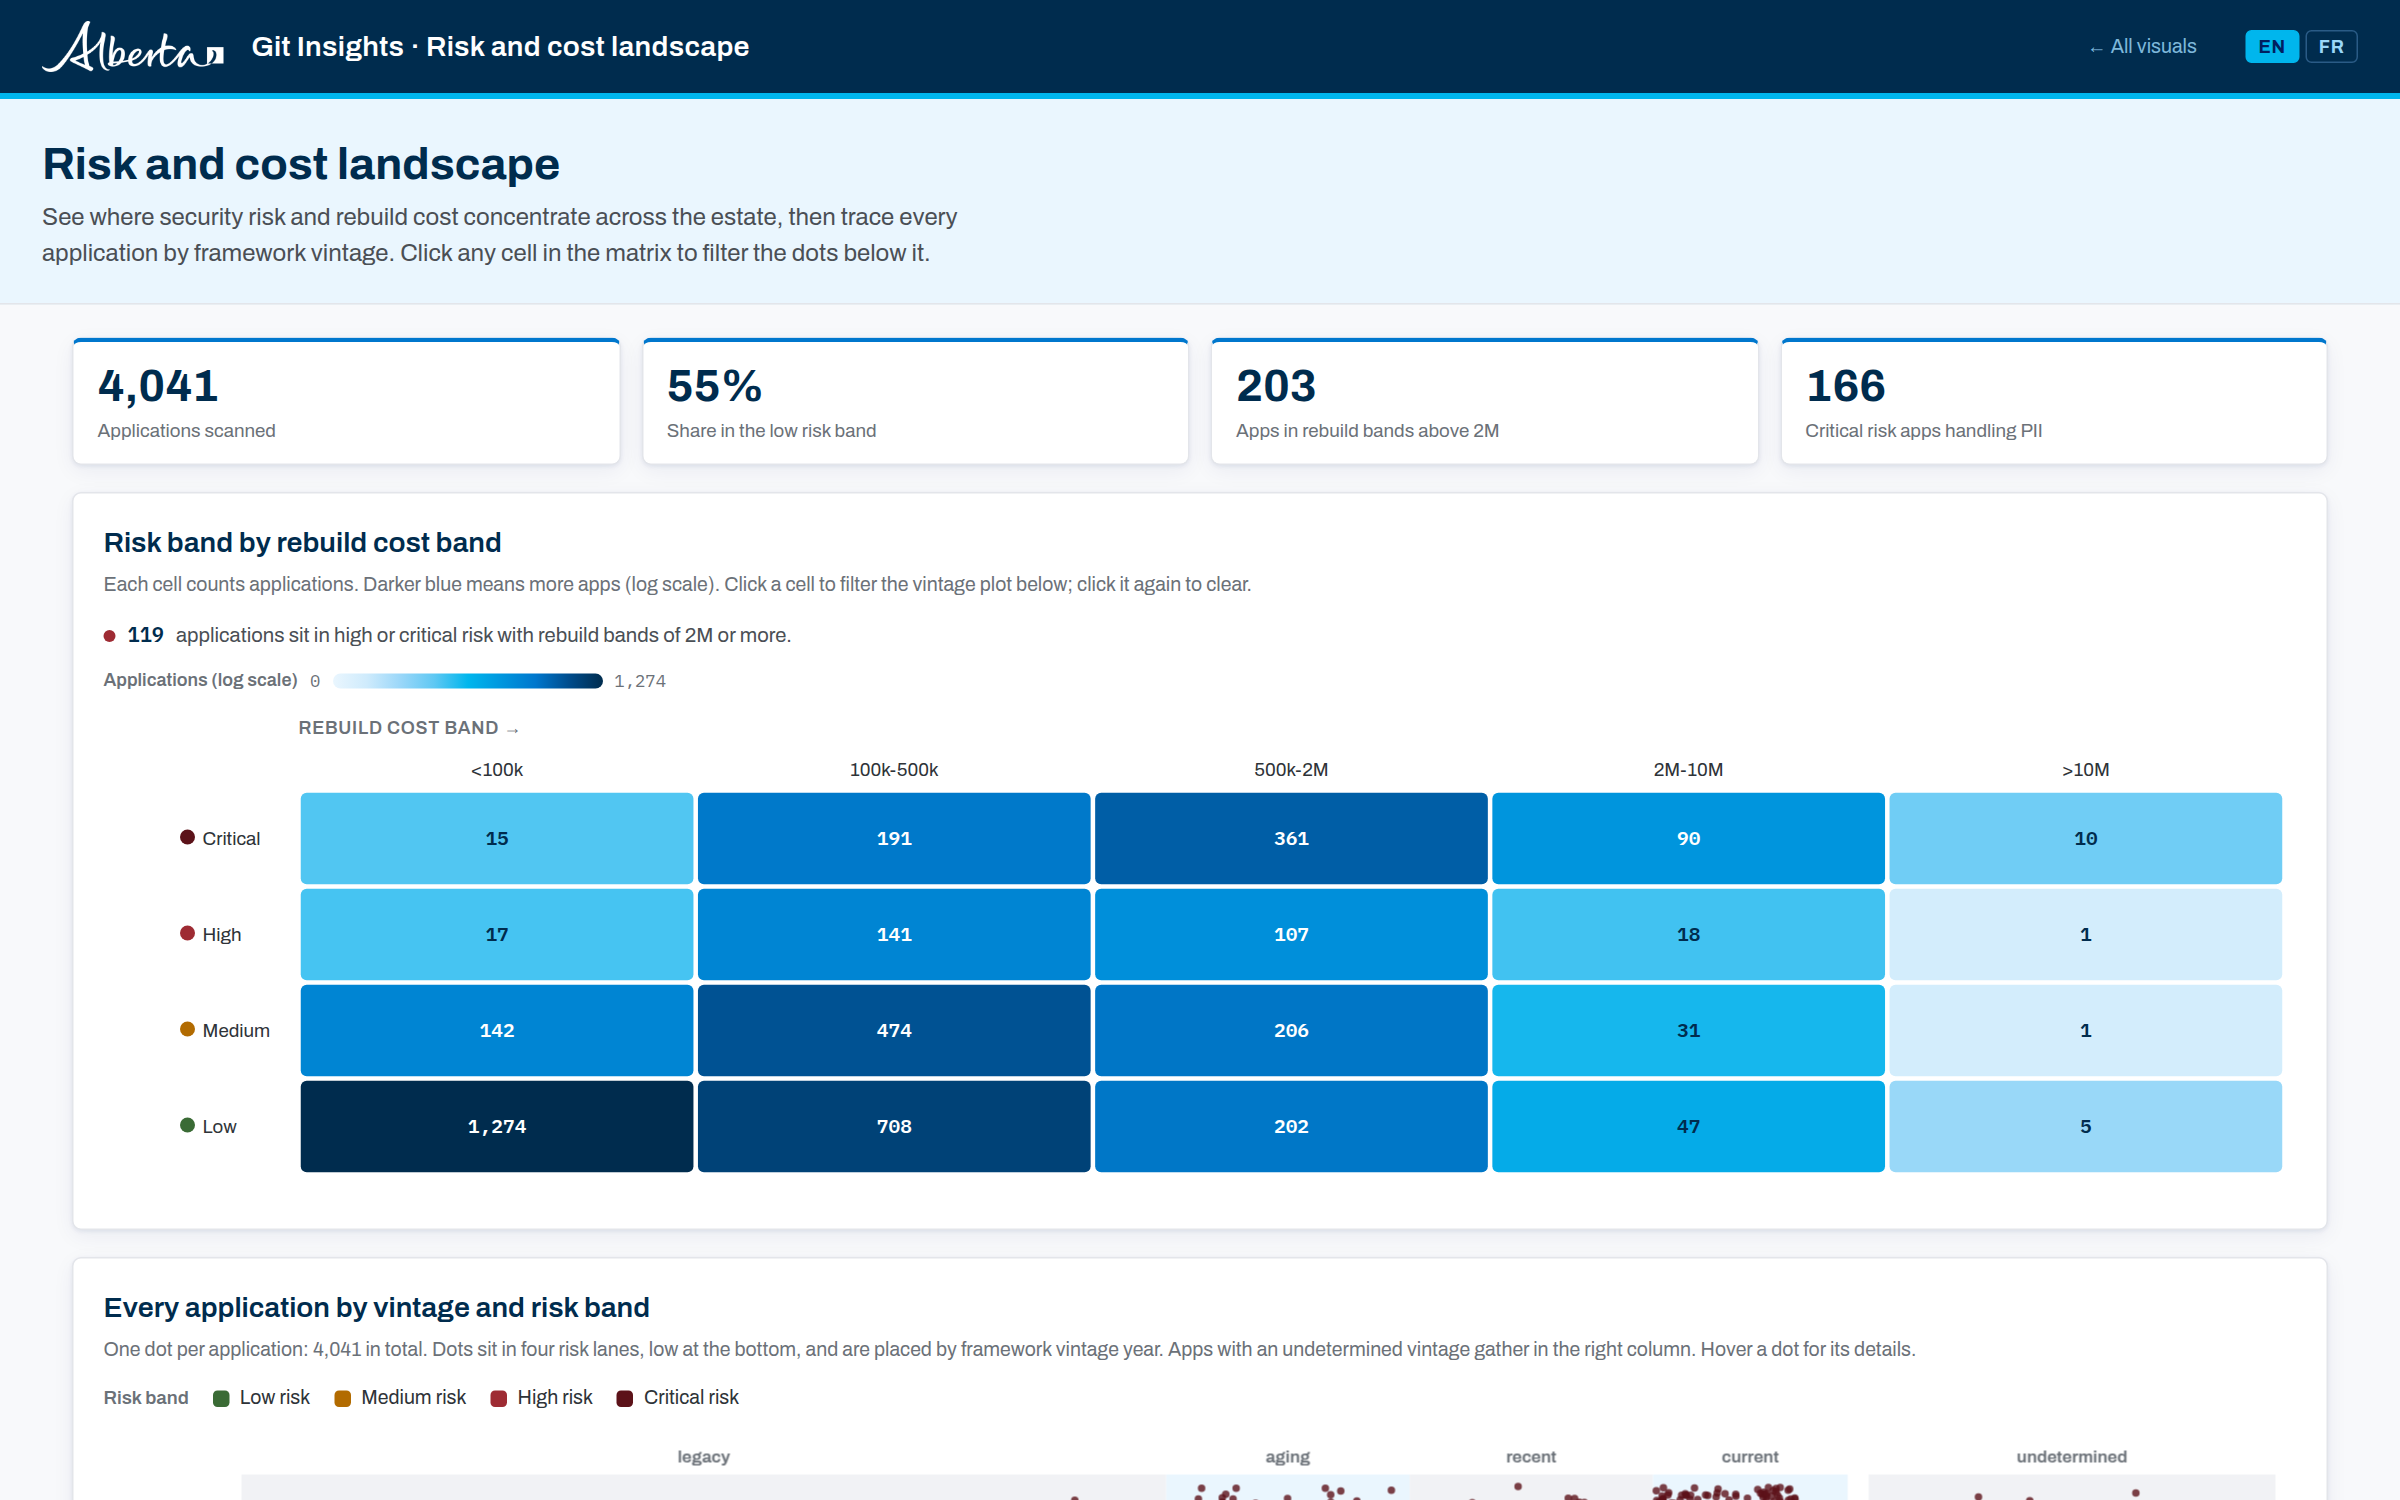
Risk and cost landscape
A risk by rebuild-cost heatmap coordinated with a 4,041-dot beeswarm of the estate across technology vintage.
 09print briefing
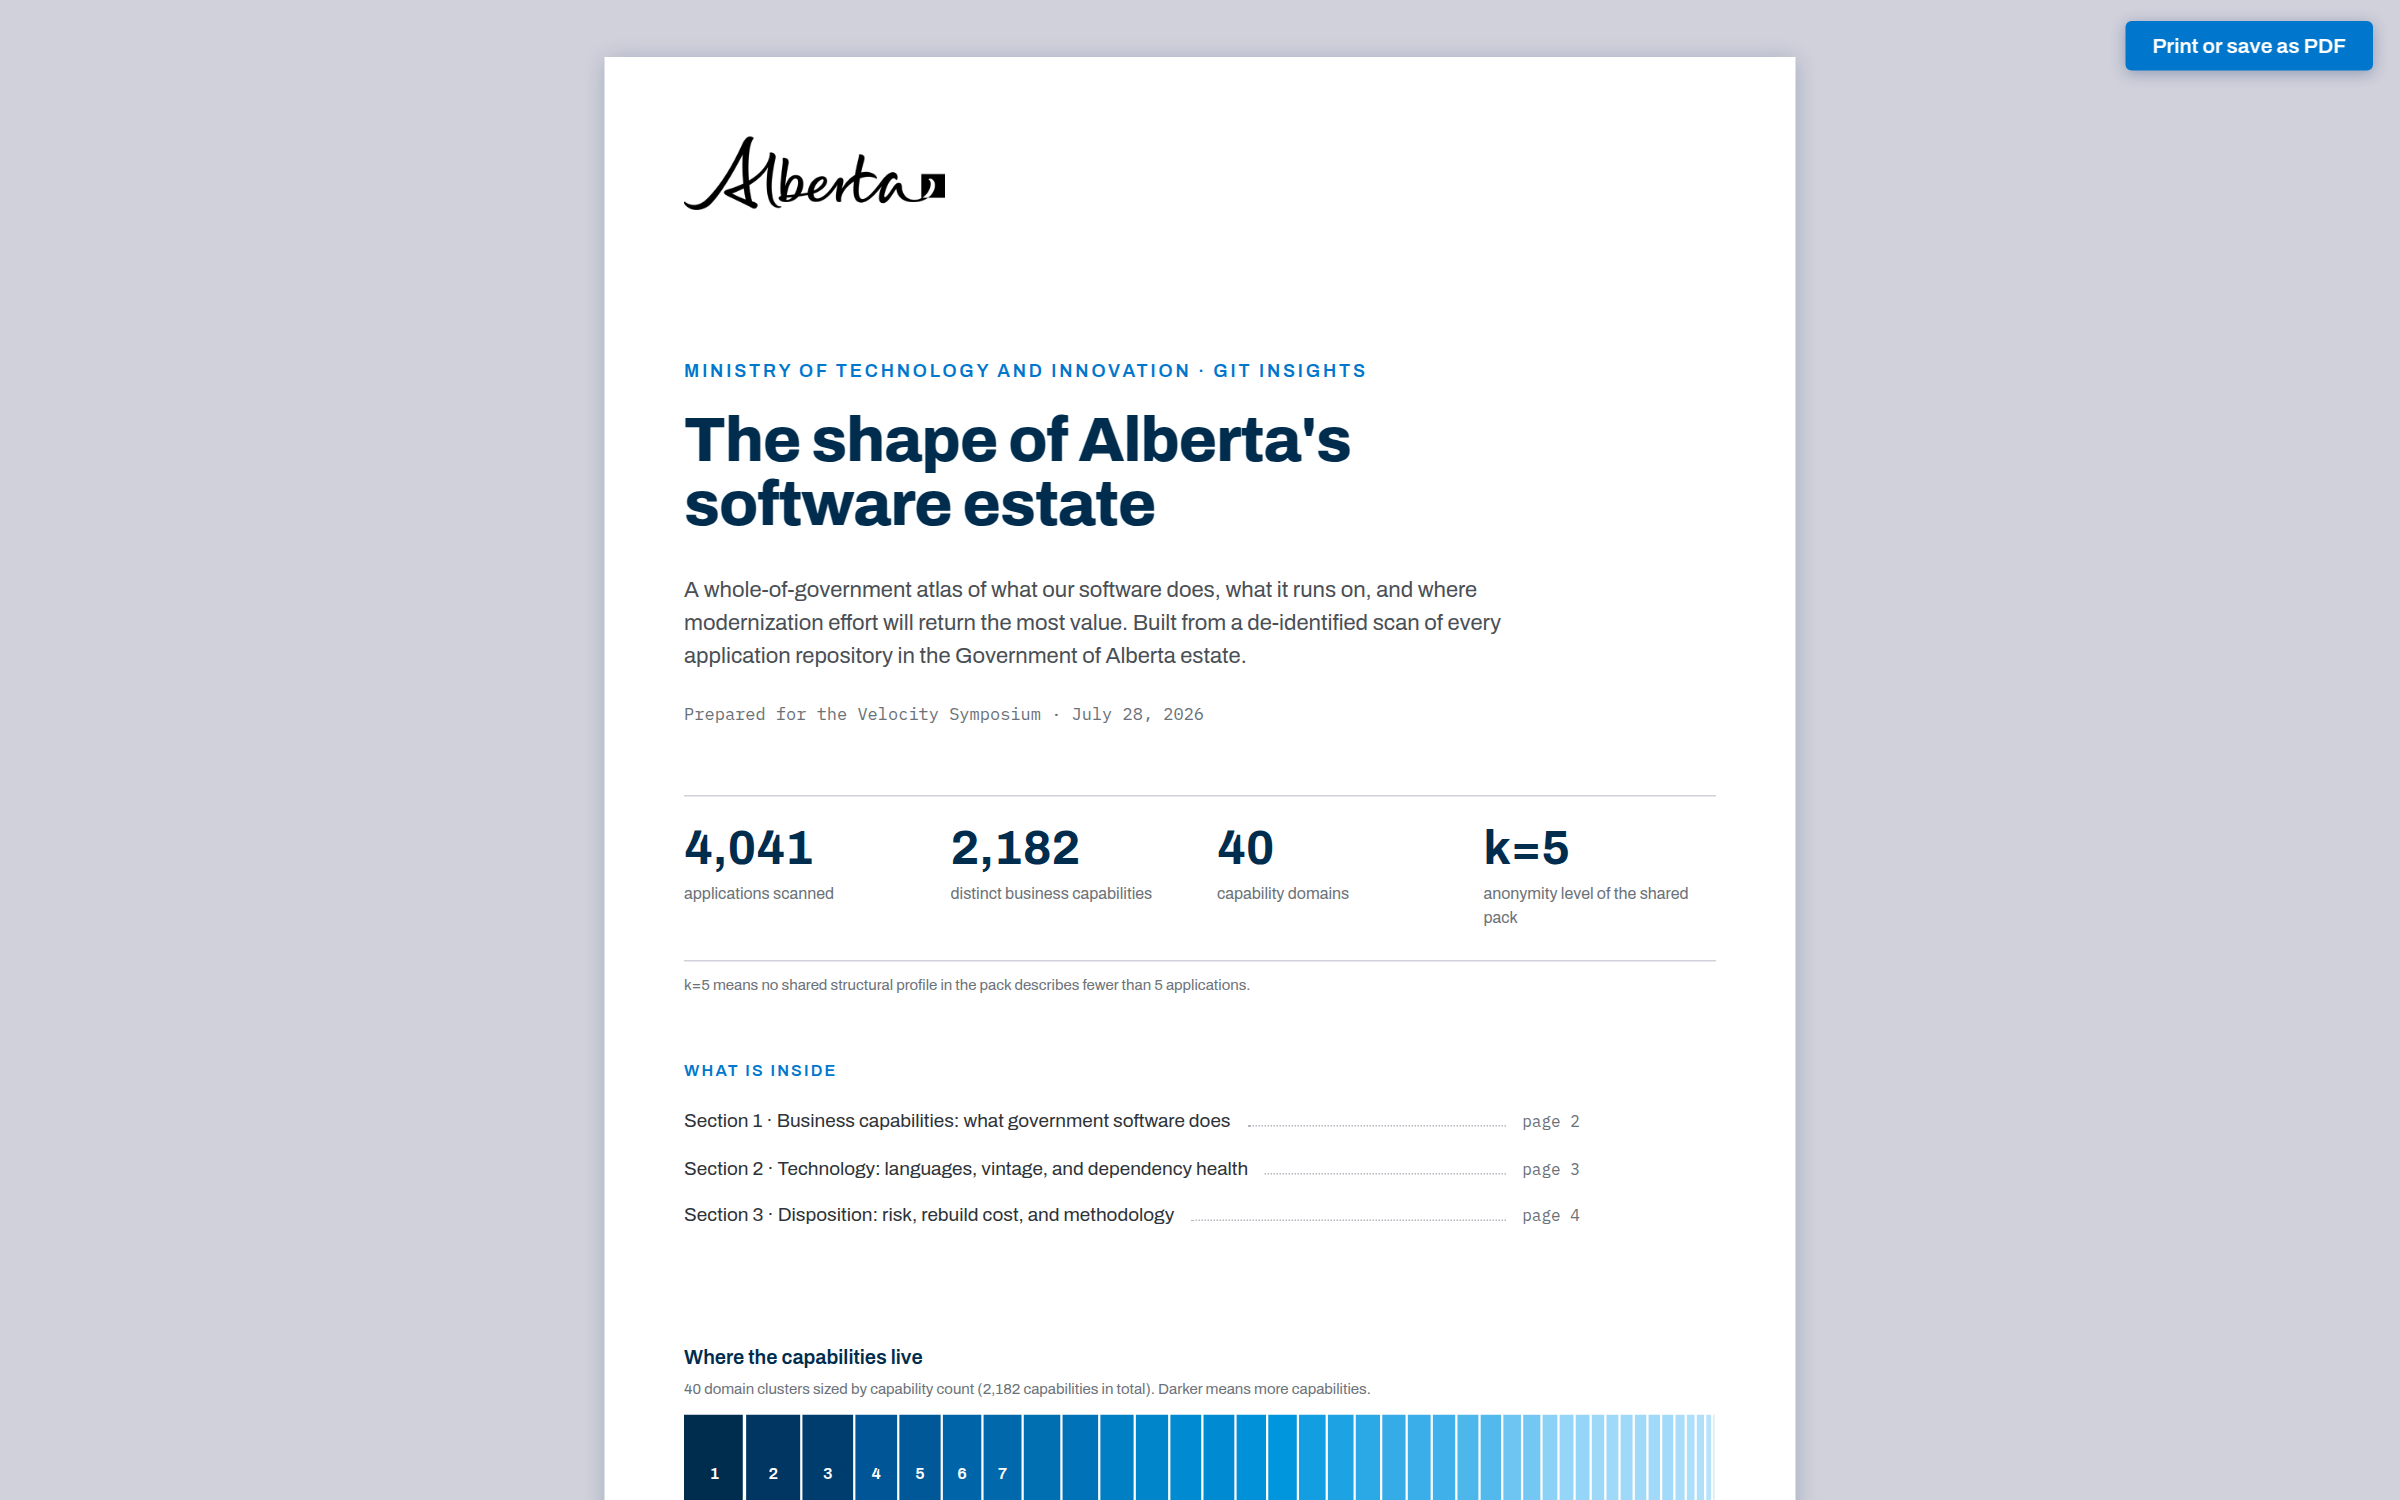
Executive briefing
A four-page print-designed report built live from the data, exportable to PDF with node scripts/export-pdf.js.
 10data joins
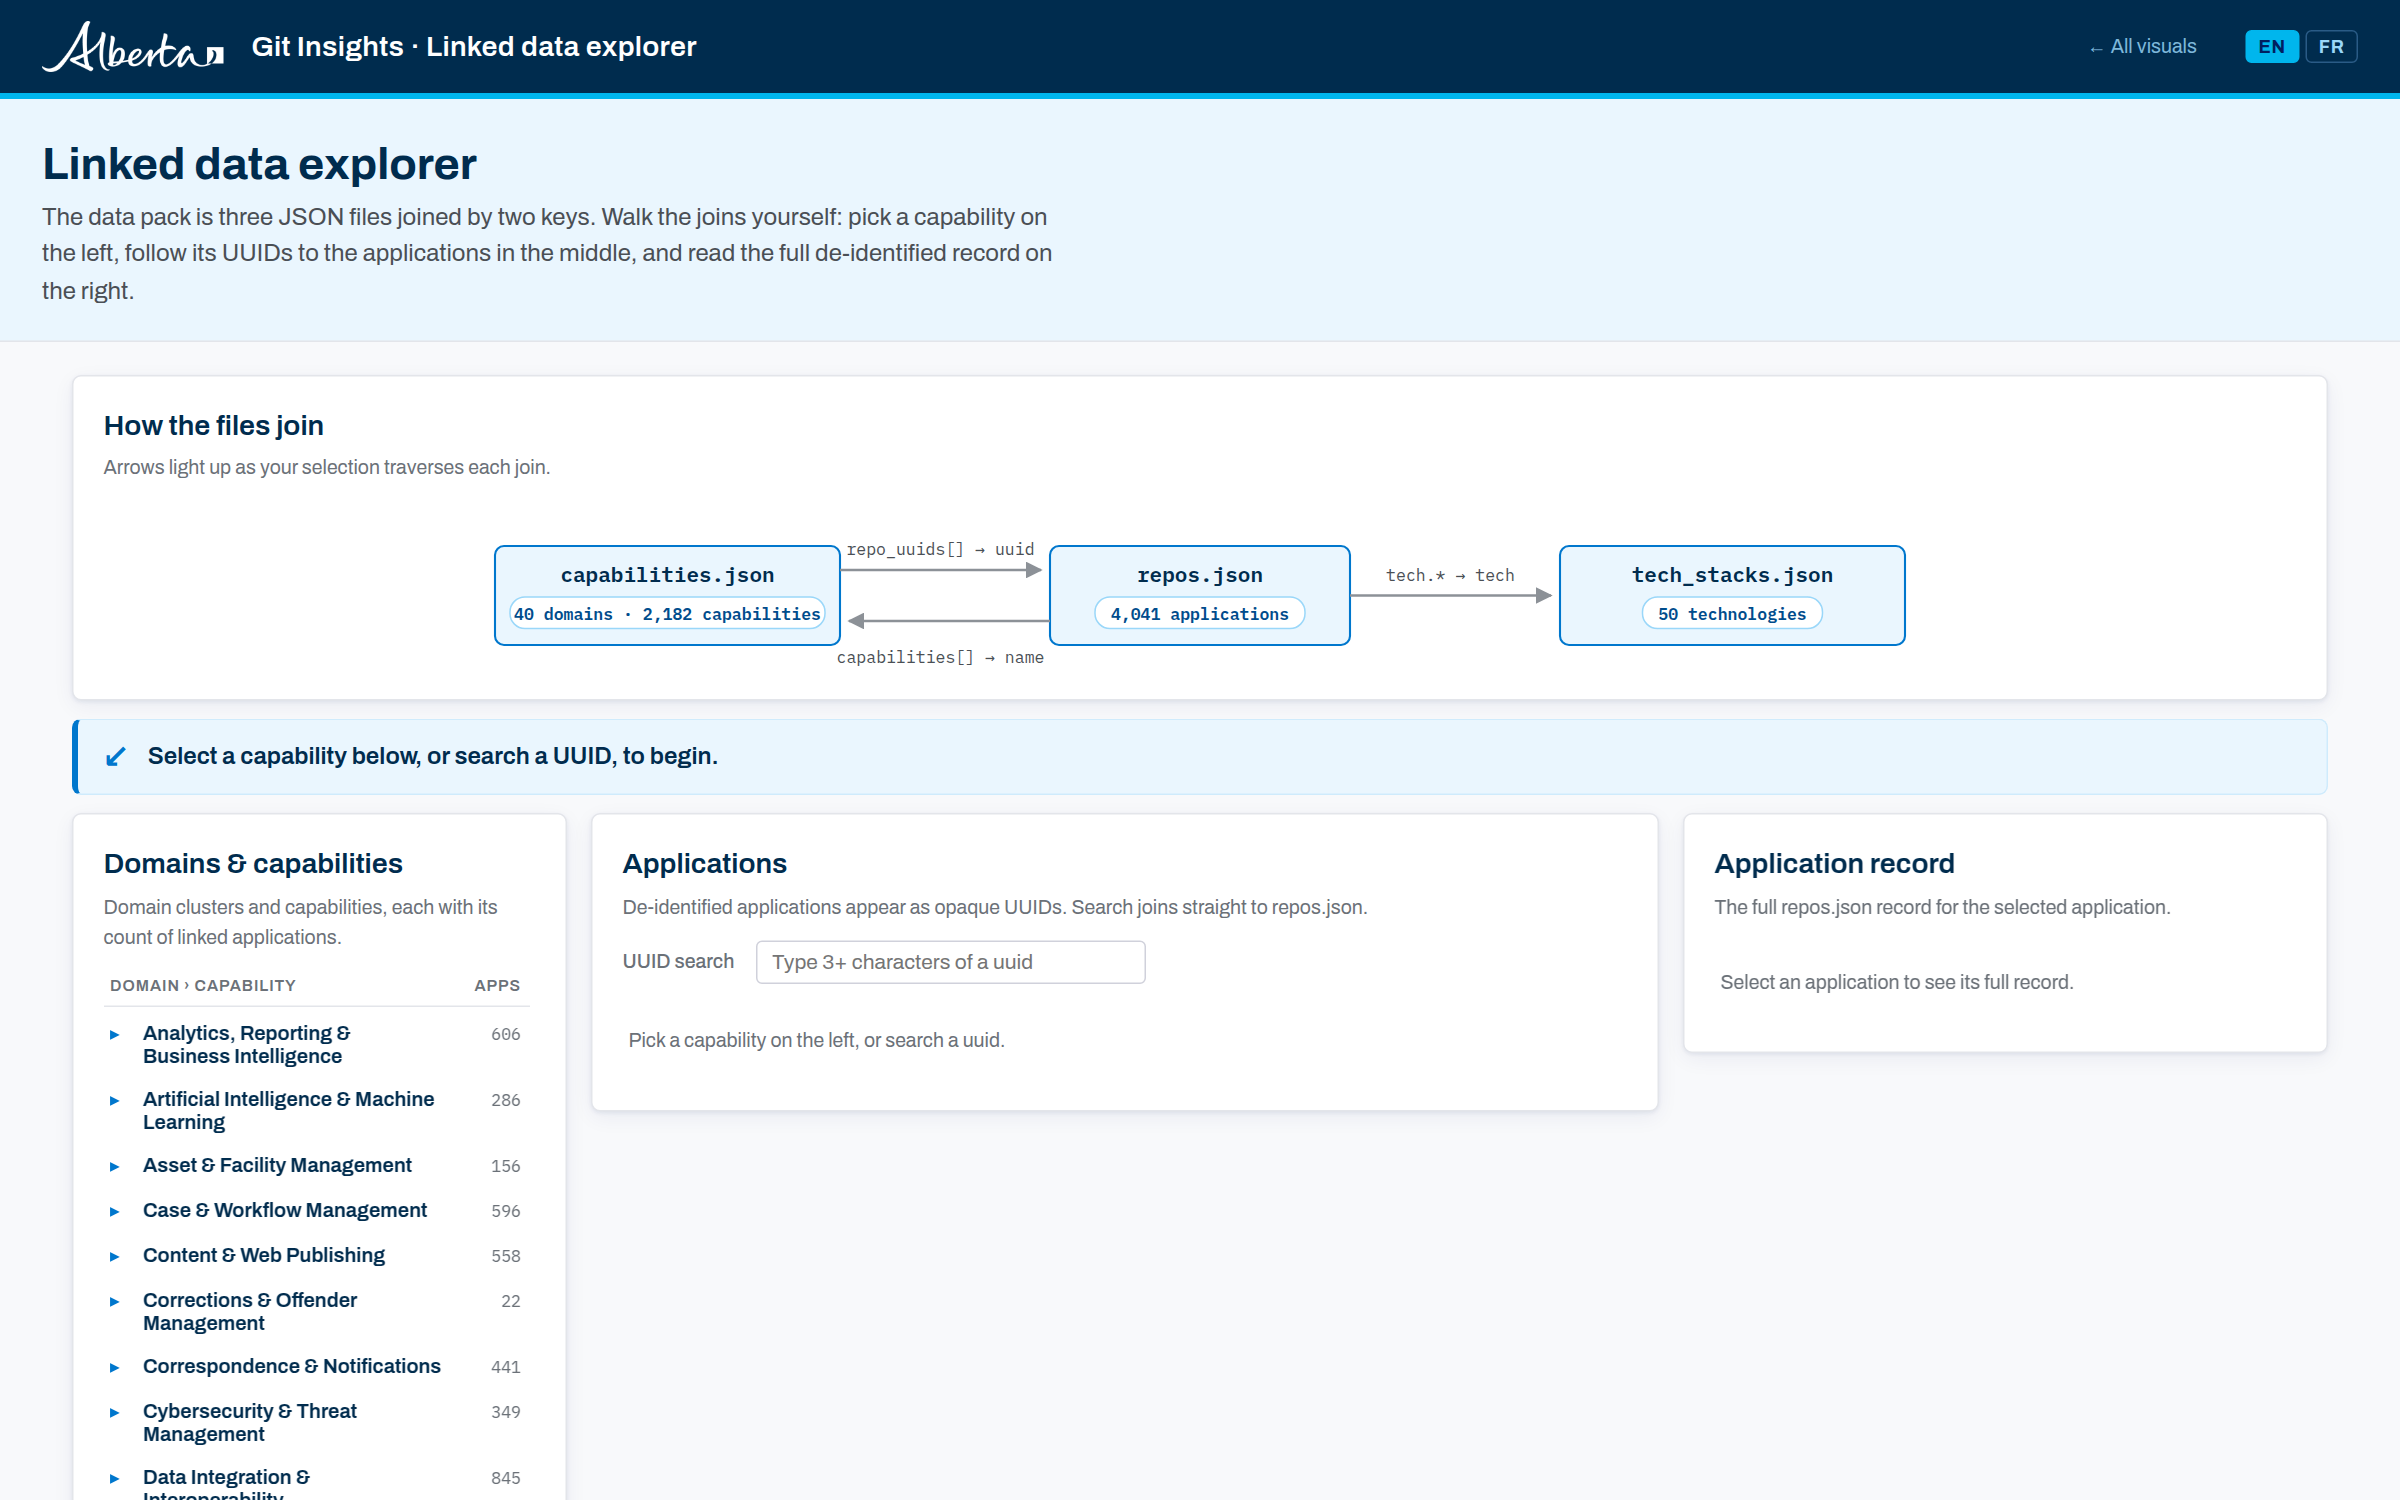
Linked data explorer
Three linked columns showing exactly how the JSON files join: capability to uuid, uuid to record, record back to capabilities.
 113D model
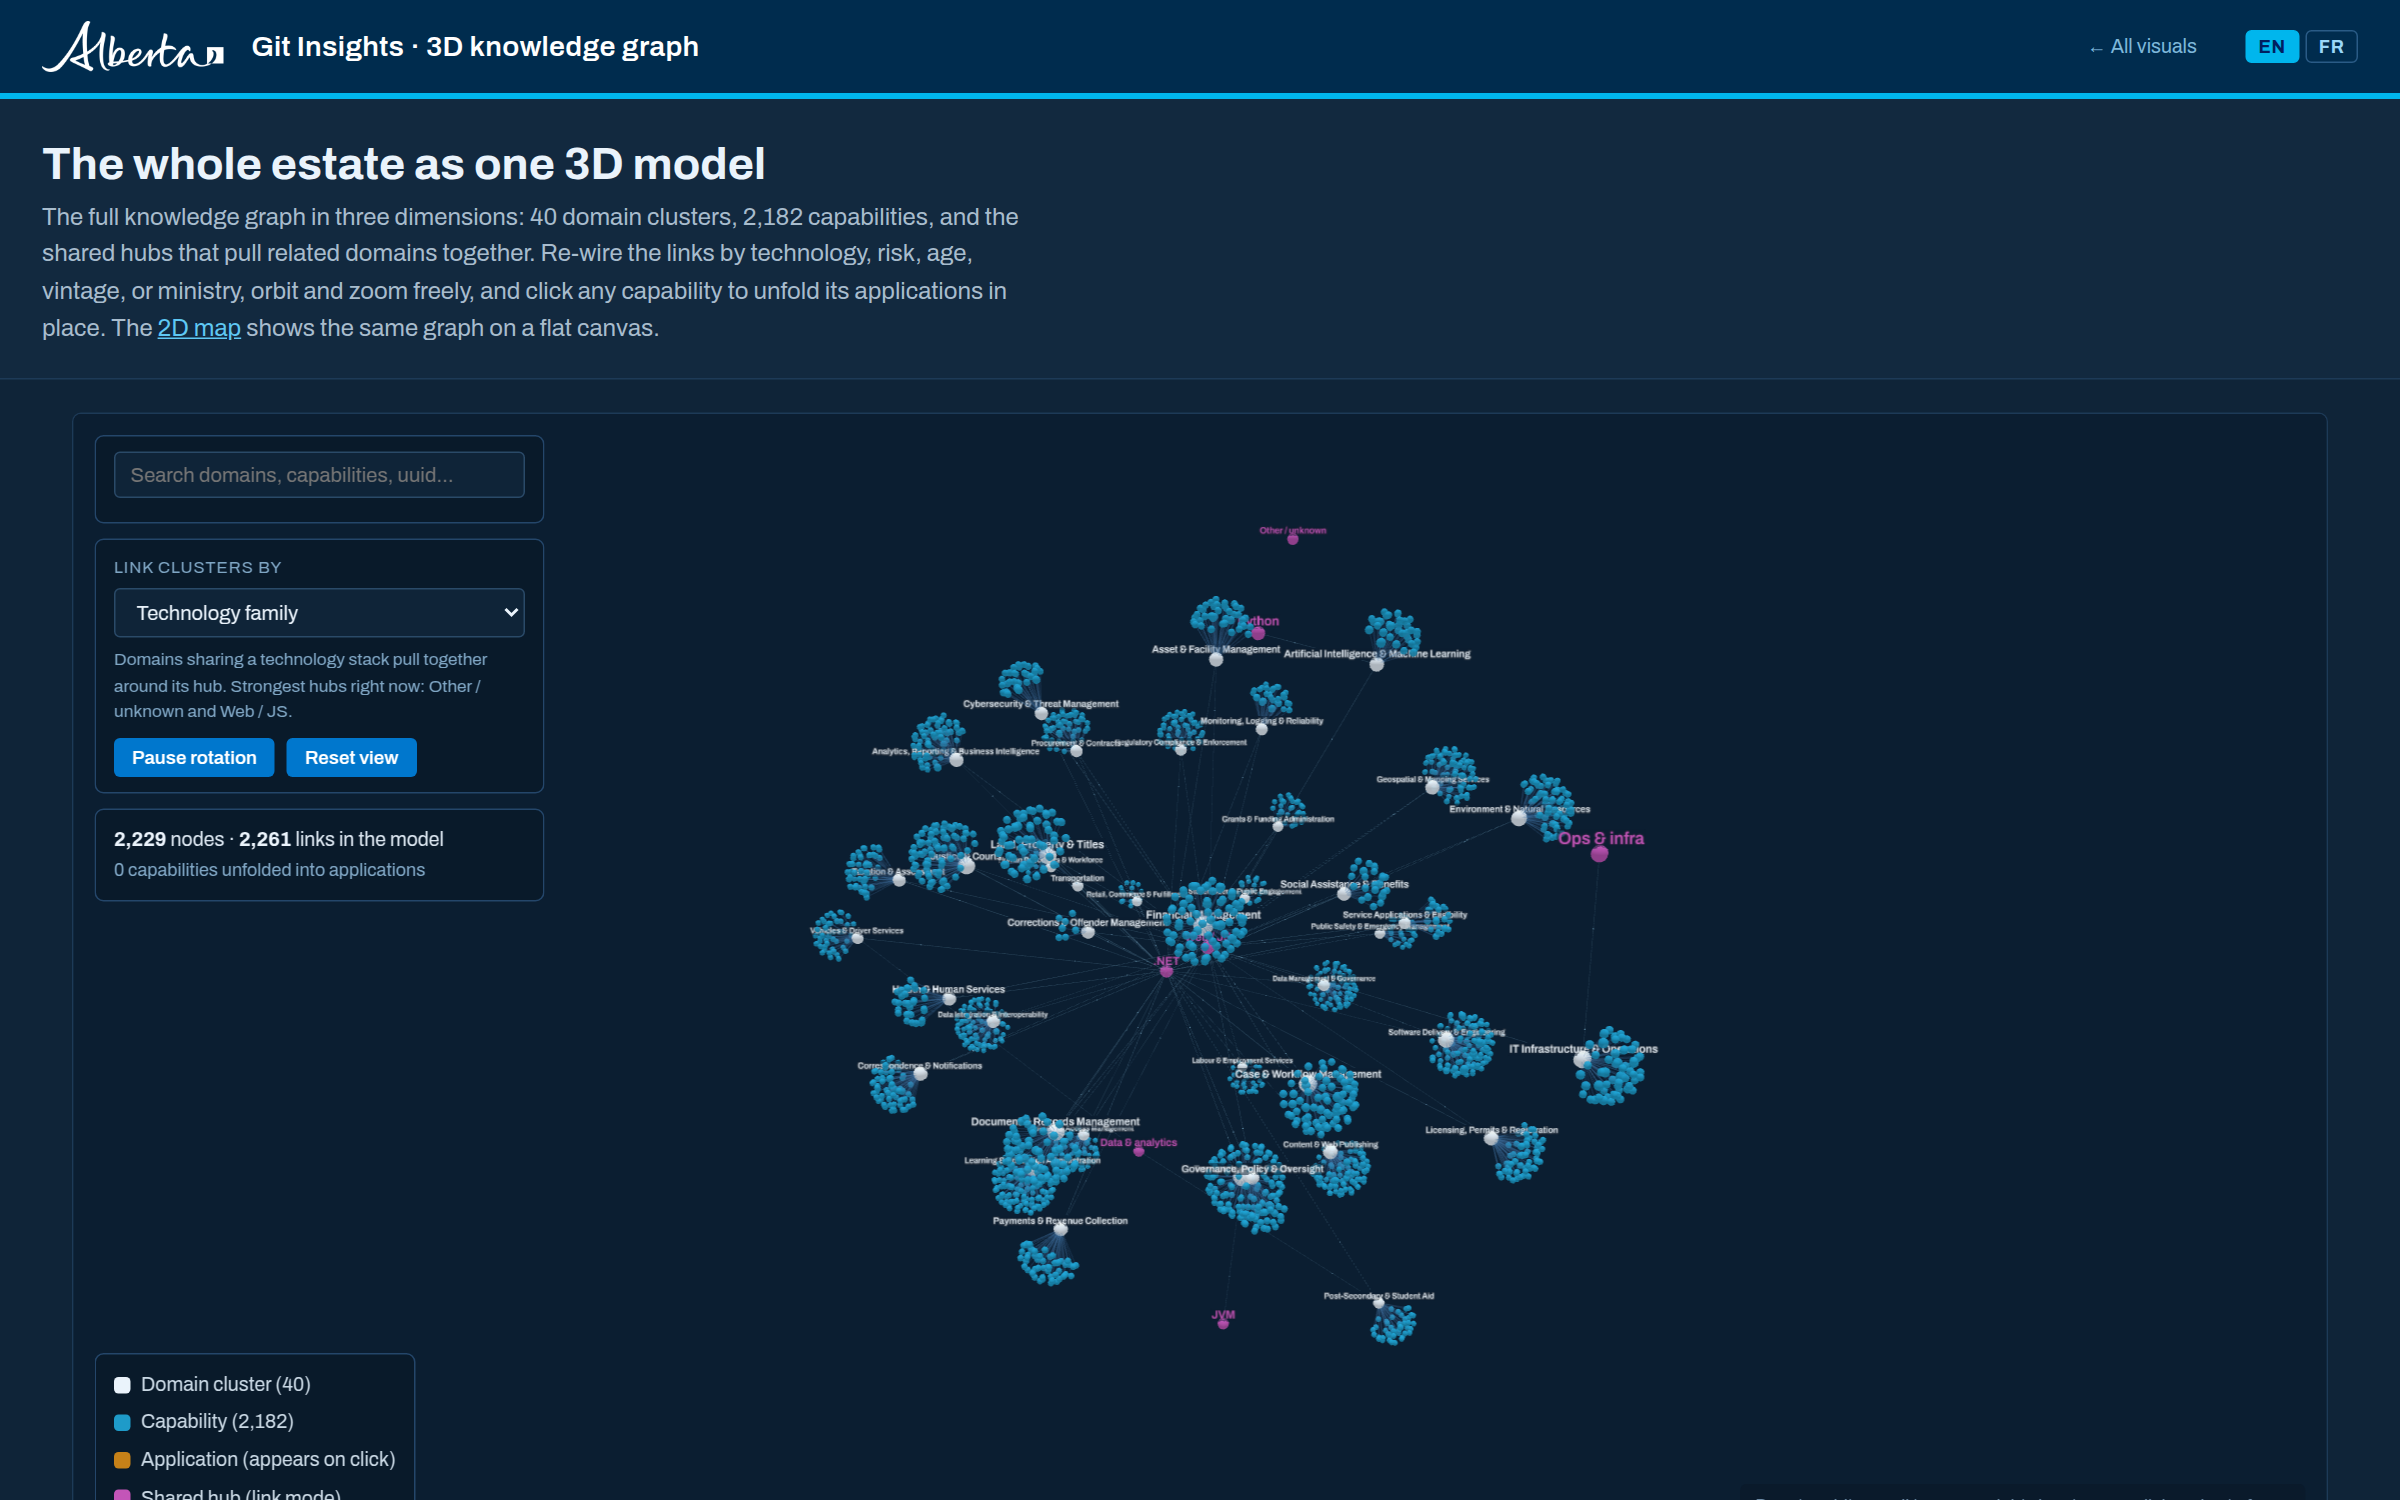
3D knowledge graph
The whole knowledge graph as an orbiting 3D model. Re-wire the clusters by technology, risk, age, vintage, or ministry and watch them snap together.
 12ministry view
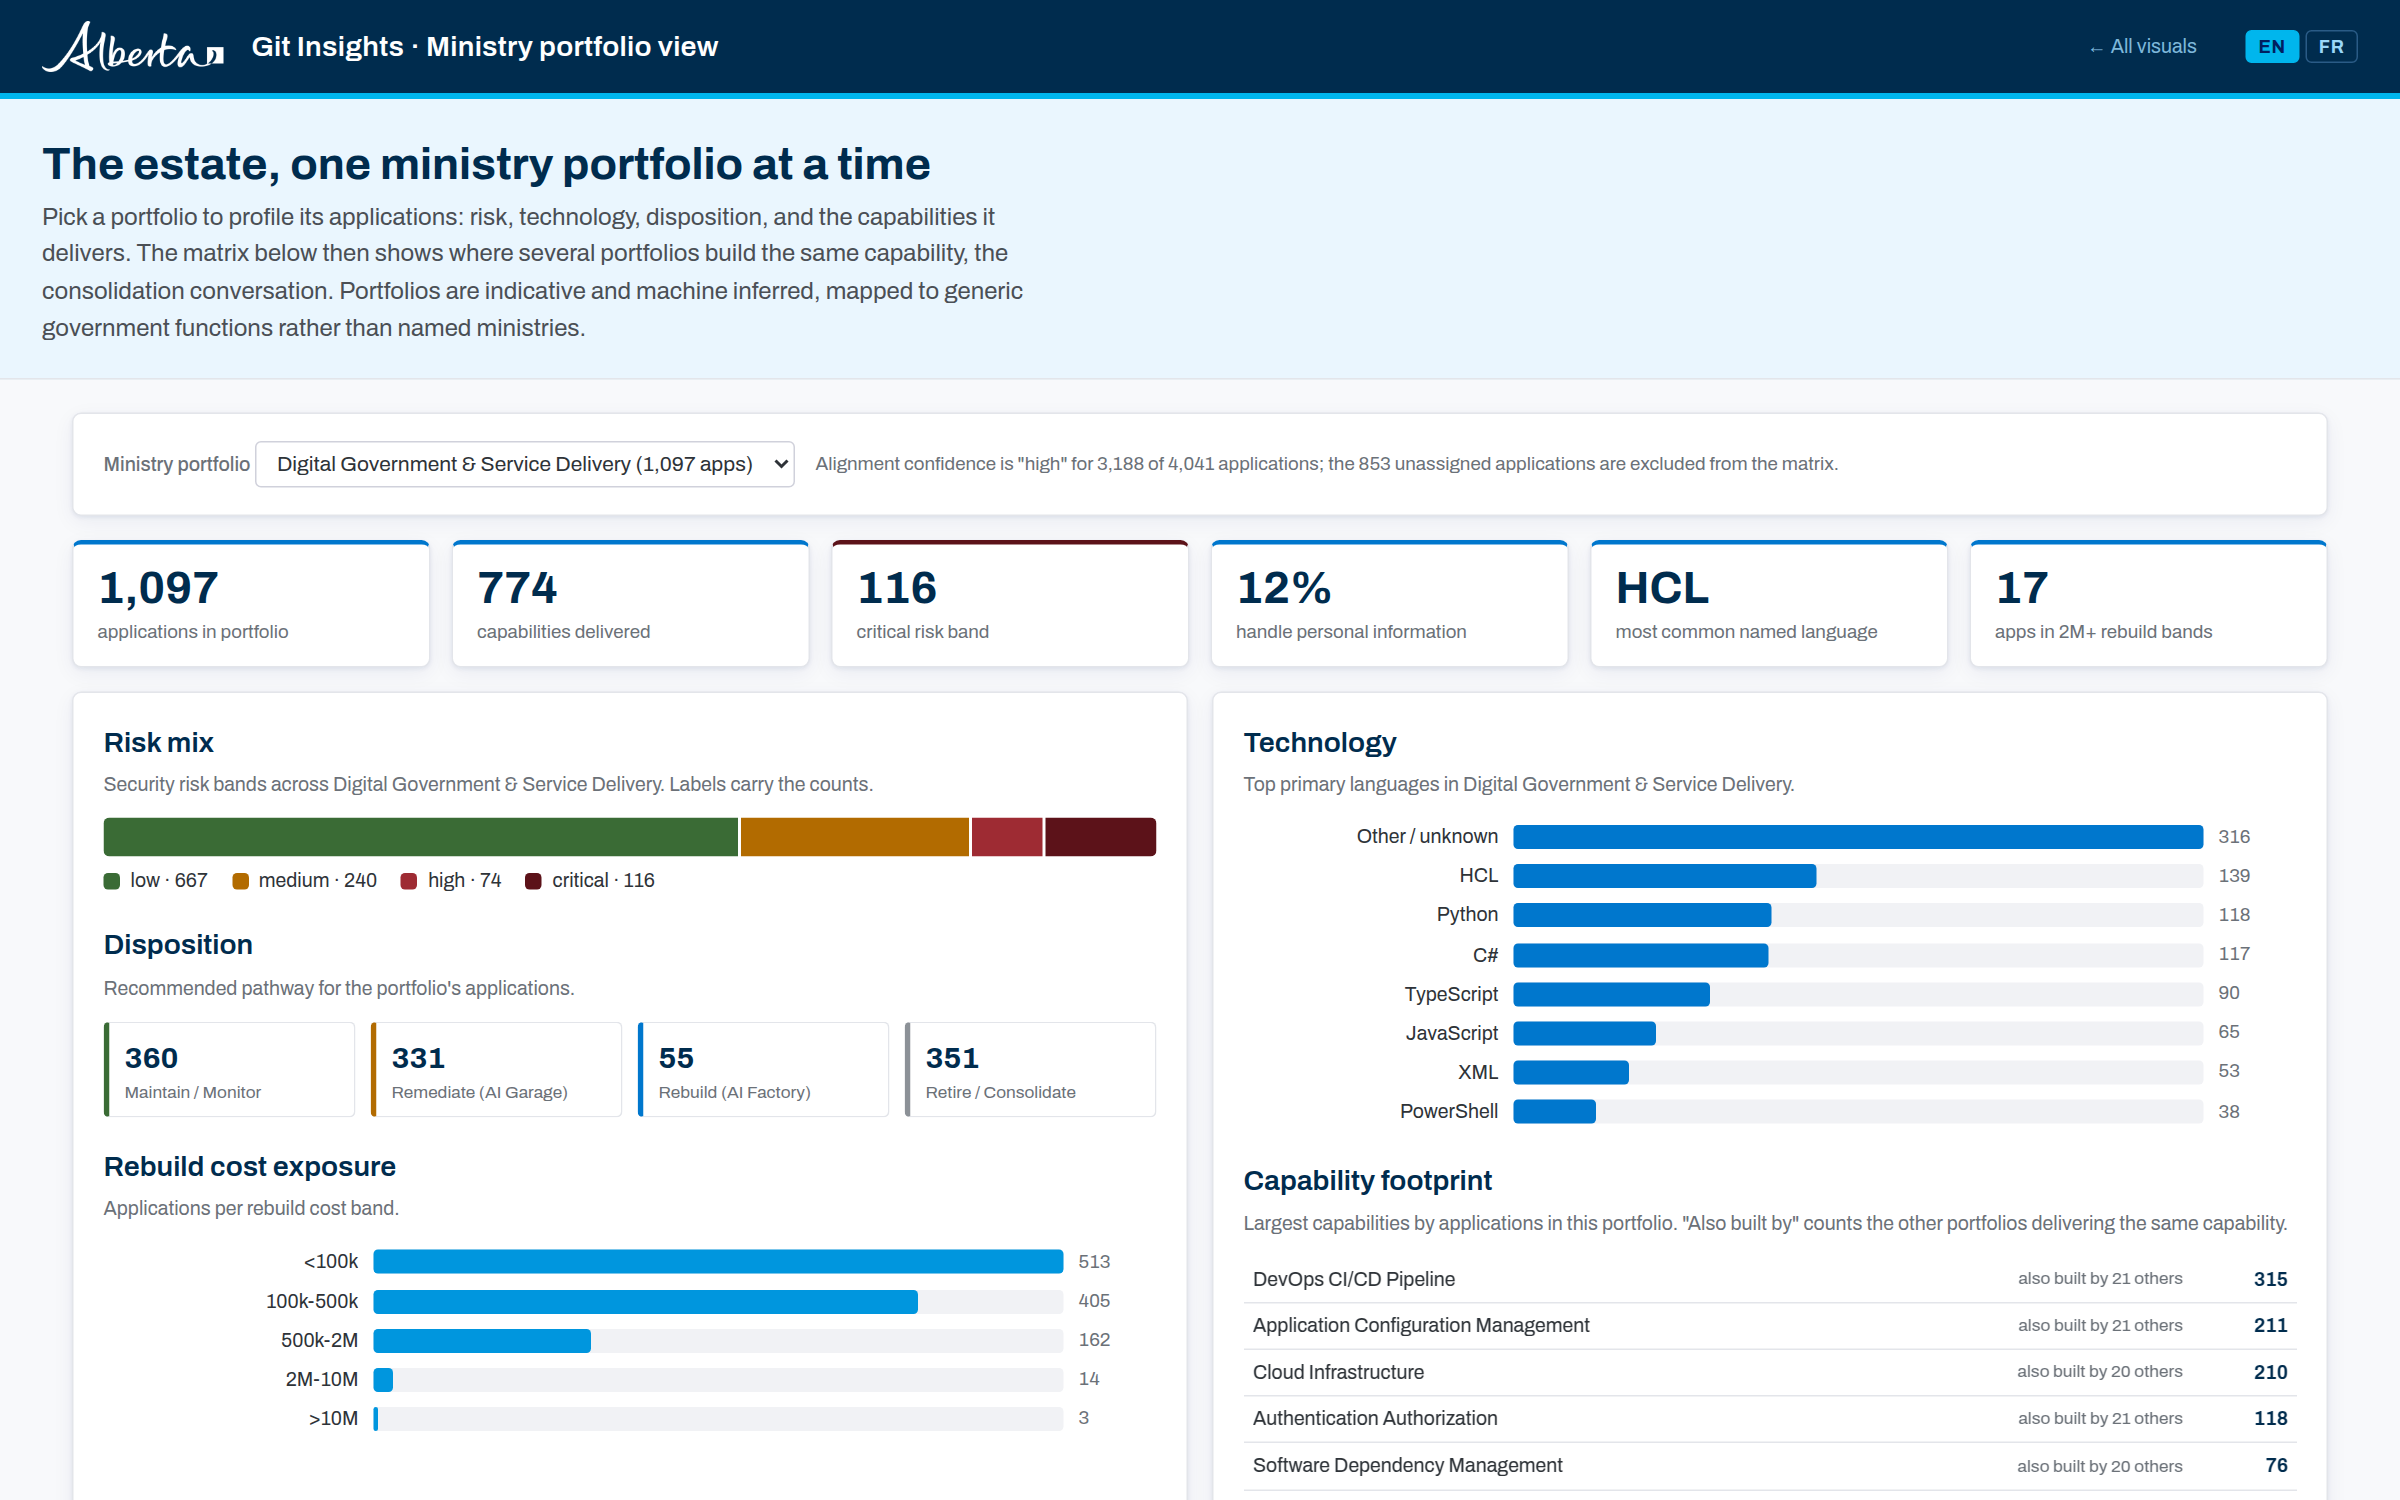
Ministry portfolio view
Profile any portfolio's risk, technology, and capabilities, then see where several portfolios build the same capability in a duplication matrix.
About the data
gov-metadata/1.0 · extracted by the Git Insights Hub application
The pack describes what government software does, on what technology,
at what scale, risk, and estimated modernization cost. It is deliberately de-identified:
application names are opaque UUIDs, security posture is banded, capability text is a generic
abstraction, and quasi-identifiers are k-anonymized at k=5. Ministries appear as indicative,
best-fit portfolios. Read data/DATA-README.md for the full method and caveats.
The data pack
Everything below is reloaded on every page view.
data/repos.json4,041 application recordsdata/capabilities.json40 domains · 2,182 capabilitiesdata/tech_stacks.json50 technology rowsdata/provenance.jsonrun metadata + redaction summarydata/DATA-README.mdmethod, screening, caveats